- Review students’ written summary of the challenges and possible solutions to measuring microbial populations. This could be done in teams and posted around the room for further discussion.
- Student Sheets: Pre/Post-assessment (Google Doc | Word Doc)
Lesson 1 – Introduction to Saline Environments & Microbial Halophiles
This is the first lesson of the Observing Beyond our Sense Module. In this lesson, students will be introduced to saline environments and microbial halophiles. Environments of differing salinities form on earth. Human activities impact saline environments by altering the salinity and/or introducing pollution. Extremophilic organisms such as Halobacterium salinarum can live in high salinity environments.
Objectives
See the NGSS listed in the left-hand menu and below. When applicable, connections to 21st Century Learning Skills and other published standards are also included in the chart below. In addition, for this lesson, here is a breakdown of:
What Students Learn:
- Environments of differing salinities form on earth.
- Human activities impact saline environments by altering the salinity and/or introducing pollution.
- Extremophilic organisms such as Halobacterium salinarum can live in high salinity environments.
- Evidence indicates similar saline environments once existed or now exist on other planets.
What Students Do:
- Propose reasons why salinities of water bodies differ across the globe.
- Brainstorm how they could measure populations of microbes from these saline environments.
| Aligned Next Generation Science Standards | ||||||
| Performance expectation:
HS-ETS1-2. Design a solution to a complex real-world problem by breaking it down into smaller, more manageable problems that can be solved through engineering. HS-LS1-5. Use a model to illustrate how photosynthesis transforms light energy into stored chemical energy.
|
Instructions
As a pre-module homework assignment, you can have students access this short article on new techniques to measure brain activity. This article specifically discusses brain neurology as a system and the need for novel ways to “see” into it. Taken from August 2011 HHMI Bulletin, vol. 24, No.3 “Let’s Get Small“ by Helen Fields.
Warm-up: Pass out a pre-assessment worksheet (Word Doc | Google Doc). Encourage students to put an answer down for each question even though they may not know the answer. Lead a class discussion based on questions they may have. Collect and keep these papers. At the end of the unit, have students take the same assessment and then compare their first assessment. Discuss any lingering questions. Students could discuss the assessments in a seminar format where they compare each answer and discuss similarities and differences in their thinking. An organizing worksheet could encourage them to take turns recording. Each group could then report to the entire class any items requiring clarification or comment.
INTRODUCTION
This introductory PowerPoint provides background information on high salinity environments, leading up to a case study requiring measurements of microbial populations. The case study provides a framework for the key issue explored in this instrumentation unit: How do scientists measure what we cannot directly observe with our senses? Students’ written summary of the challenges and possible solutions to this case study’s measurement problem serves as the pre-assessment about their current thinking on instrumentation.
High Saline Environments & Extremophiles
Lesson PowerPoint (PowerPoint | Google Slide).
There is a student worksheet to go with this (Word Doc | Google Doc).
- Why does the salinity of oceans and lakes differ across the globe? (Slides 2-4)
Students examine a world map to brainstorm why the salinities of the oceans might differ. They next try to brainstorm why an inland lake—The Great Salt Lake—is saltier than the oceans. Student responses will vary, but might address overall water circulation due to a variety of factors. There could be differing incoming sources of water with varying mineral concentrations (springs, glacial or snow melt, rainfall, freshwater rivers, etc.). There may also be differences in abilities to circulate and connect to other water bodies and differing or limited means for water to leave the system. The Red Sea and the Great Salt Lake both experience high rates of evaporation.
- How have human activities impacted these saline environments? (Slides 5-9)
Students are shown examples of how human activities such as pumping and creating salt fields for nutritional needs and agricultural fertilizers have altered inland saline environments such as the Great Salt Lake and Mono Lake in California. The light blue areas in the earlier Great Lakes slide are shown to be from human made evaporation ponds.
- What life can survive in these high saline environments? (Slides 10-11)
Students are introduced to one example of a halophilic “salt loving” microbe from the domain Archaea —Halobacterium salinarum .
Background Note for Teachers: Contrary to what the name suggests, Halobacterium salinarum is not bacteria but rather a member of the domain Archaea. Additional information about Domain Archaea and its relationship to Eukaryotic and Prokaryotic organisms can be found in the “Domain Archaea:” document (pdf | google doc), and information on differing types of Extremophiles can be found in the “Life in Extreme Environments” document (word doc | google doc).
- Where else do these high saline environments—and possibly extremophiles–exist?
Students are shown examples of evidence that similar saline environments have existed on Mars (Slides12-14) and that saline environments deep beneath frozen surface water in Antarctica (Slide 15) could be similar to environments beneath the frozen surface of Jupiter’s moon Calisto (Slide 16).
- How can we study these environments? What could we measure?
Slide 17 gives an overview of why these high saline environments are important ecological systems. Slide 18 introduces the concept of a water management plan to evaluate the needs of the ecosystem and to study the impacts of pollution. Slide 19 introduces the case study that will be the culminating project—creating a water management plan for ‘Bad Water’ in California’s Death Valley. To study the current conditions at the site, students will determine population sizes for microbial indicator species. Slide 20 introduces the focus of the unit—How do scientists use instrumentation to measure what they cannot directly observe with their senses? The students are prompted to think about how they could measure populations of extremophilic microbes in water samples. Possible challenges to the measurements include: The microbes are too small to see with the naked eye. There may be other material in the sample. The microbes’ populations in the samples will continue to change over time. The number of cells in a small sample of water could be a high number difficult to quantify or may be such a low number that they are difficult to find in the sample. Student ideas of how to measure the populations will vary. It is expected that most will discuss some direct means of physically counting the microbes (microscopes, etc.). The focus is not to lead them to the eventual solution, but rather to give students an opportunity to reflect on their current thinking about measuring possibilities & instrumentation. After the discussion, students should complete a written summary of the challenges inherent to this measuring task and possible approaches to counting the microbial populations.
Career Connection
At the end of Lesson 1, your students will be ready for their first Career Connected Activity (CCA). These are called Career Connected Activities because they: 1) highlight STEM careers, and 2) are connected specifically to the scientific learning that took place in the previous lesson. These activities have been crafted to build awareness (especially for unique STEM careers and pathways), identity and to build “soft” skills such as 21st Century Learning Skills.
To plan for this, first consider how much time you want to devote to this additional content. For each lesson, we offer four options, listed in columns as A-D. You can mix and match the options for each lesson. These means you can have some of these activities take place in class and some out of class (as homework). Second, based on how much time you have available, choose one section of the career connected activity below. For every one of these four options, prior to beginning the CCA, first recap what your students learned in the lesson they just completed. This will help them internalize the content of the CCA to improve the positive impact of these activities.
What to do if you have this much time available:
| A homework/ outside of class | B 5-10 minutes in class | C half of class period
(~25 minutes) |
D entire class period (~50 minutes) |
| Individual students make list of careers and college majors that could be involved with the Lesson PowerPoint (PowerPoint | Google Slide). | Whole class discussion using whiteboard or projector: Brainstorm on careers and college majors that could be involved with the Lesson PowerPoint (PowerPoint | Google Slide). | Brainstorm on careers, college majors, and school courses that could be involved with the Lesson PowerPoint (PowerPoint | Google Slide).This can be done in small groups, with those groups reporting out to the entire class. | C & Students develop a series of interview questions for one of these careers. Students then make a time-based education flowchart for one of these careers, focusing on the classes they should take in high school (see flowchart example below). |
Example Careers:
- Extremophile Biologist, Hydrologist, Mining Engineer, National Park Director, Botanist, Heavy Equipment Operator, Local Historian
Example Majors:
- Ecological Restoration, Biology, Chemistry, Engineering, Environmental Resource Management, Marine Biology
Interview Tips:
- StoryCorps has an excellent 3 minute video on how to conduct an interview.
Time-based education flowchart example:
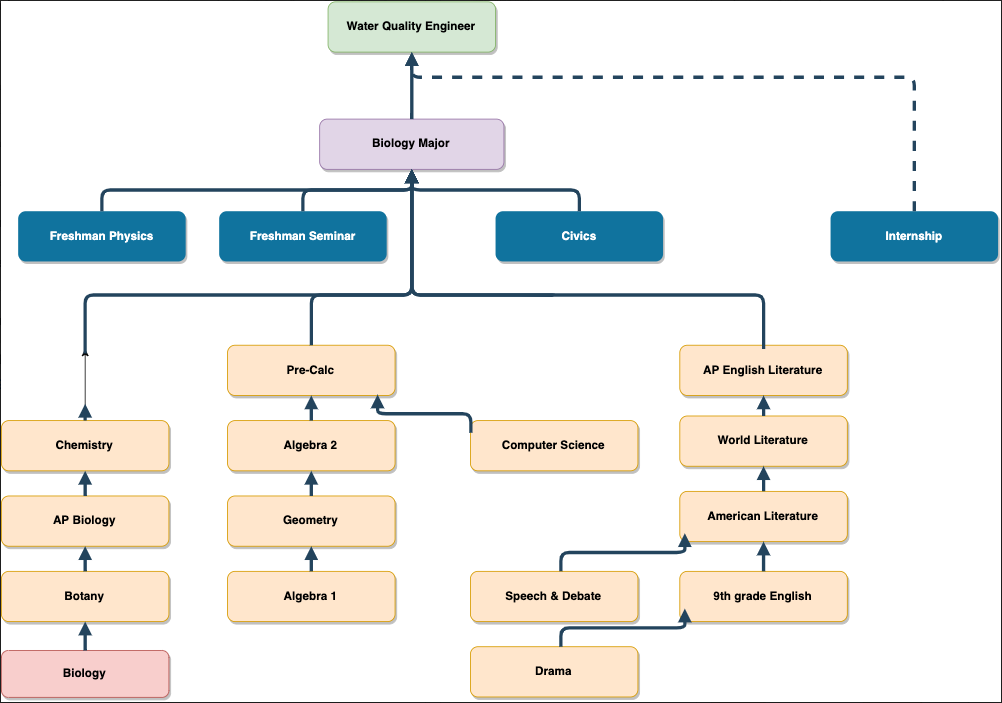
This flowchart, made with the free online tool: www.draw.io, has an emphasis in the topics: MATH, SCIENCE, COMPUTER SCIENCE, HUMANITIES.
Other topics can include: ART, MUSIC, DRAMA, HISTORY, etc.
Assessment
How will I know they know?Resources
- Teacher: Pre-assessment Answer Key (Word Doc | Google Doc), Student worksheet for Intro ppt Key (Word Doc, Google Doc), Domain Archaea document (PDF | Google Doc), Life in Extreme Environments document (Word Doc | Google Doc)
- PowerPoint: Intro to the Case Study, Saline Environments & Halophiles (PowerPoint | Google Slide)
- Student Sheets: Pre/Post-assessment (Google Doc | Word Doc), Student worksheet for Intro ppt (Word Doc | Google Doc)
Extension
For students interested in extremophiles see the extensions for the modules “Ecological Networks” and “Environmental Impact on Gene Networks”
Extremophile ‘Wanted’ Poster (Word Doc | Google Doc), Wanted Poster Teacher Tips (Word Doc | Google Doc) , “I Can Top That” (Word Doc | Google Doc)
Also, this video and article might engage students to think more about the importance of water quality and monitoring: NPR’s Science Friday Series – Bitter Water.
- Summary: Mines are a familiar sight to people living on the Navajo Nation reservation – but how is extracting resources affecting their water? In this video, part of the Breakthrough: Portraits of Women in Science series, produced by NPR’s Science Friday in collaboration with HHMI, watch as hydrologist Karletta Chief works to monitor water quality and educate her community on how industrial activities are affecting the water they rely on for spiritual, cultural, and agricultural uses.