Lesson 3 – Defining the Problem: Ocean Acidification
 Description: The purpose of this lesson is to set the stage for students to begin a collaborative, systems study of ocean acidification (OA). Understanding that OA is a global problem that has positive and negative impacts on many groups in many ways makes it a hotly debated, political topic. We need to carefully set the stage to foster evidence-based reasoning and critical and systems thinking for this current problem.
Objectives
Course: Life Science, Integrated Science, STEM, BioChem, Marine Science
Unit: Ocean Acidification, Ecology, Biogeochemical Cycling
See the NGSS buttons in the left-hand panel of this page for an overview of the standards addressed in this lesson. Also, please see the documents on the Standards Addressed page for all NGSS, WA State (Science, Math and Literacy), and NOAA Ocean Literacy Education Standards connections. In particular, for this lesson, due to the variety of experiments completed within classrooms, students will learn and do a variety of activities. Because each student will complete different labs in this module, each student will not complete all of the listed standards. However, ideally, they will complete 1-2 sets of performance expectations. To give you a broad, big-picture overview, in addition to the aligned objectives linked above, for this lesson, here is an overview of:
What Students Learn
- Ocean Acidification is a global situation with many components, including stakeholders, with many interactions.
- Systems thinking can be used to evaluate complex situations such as ocean acidification.
- Situations that require systems studies often have many parts with many interactions, emergent properties, and reverberating effects.
- Ecosystems are dynamic, responsive, and often marked by many processes being in equilibrium. Scientific research helps us predict how ecosystems will respond to changes within their subsystems.
What Students Do
- Students begin considering the global impact of CO2 on ecosystems and identify possible stakeholders.
- Students discuss how systems thinking might be used to study and understand the Earth’s changing carbon cycle.
Instructions
Pacing Guide: One to two 50 minute periods
Purpose: The purpose of this lesson is to set the stage for students to begin a collaborative, systems study of ocean acidification (OA). Understanding that OA is a global problem that has positive and negative impacts on many groups in many ways makes it a hotly debated, political topic. We need to carefully set the stage to foster evidence-based reasoning and critical and systems thinking for this current problem.
To begin the lesson, students will watch the film “Acid Test: The Global Challenge of Ocean Acidification” either as a class or on their own. (This video is a 21-minute video produced by Natural Resources Defense Council (NRDC). It may also be viewed on YouTube. You may also want to show a short video (6 minutes) about the shellfish industry which uses the Pacific Northwest as the main example.)
The purpose of watching a video is to engage students in thinking about the global impact of CO2 on ocean ecosystems and to identify possible stakeholders for future role-play. Students should come away with an understanding of the magnitude and complexity of problems surrounding ocean acidification. The video is used to anchor a discussion of addressing these problems using a systems approach that will incorporate collaborative lab groups. The PowerPoint and discussion in Lesson 4 will help students determine what specifically to study in upcoming investigations.
Lesson Sequence:
1. Ask students to watch the NRDC developed video as a class or on their own. Have them fill in the open-ended student guide (Google Doc | Word Doc) OR this more guided student worksheet (Google Doc | Word Doc).
2. Use the content in their worksheet/guides to lead a discussion about ocean acidification. Here are student examples of completed worksheets: open-ended student guide answer sheet, guided student worksheet answers.
Please note: If you want students to watch the video in class and need to give them class time to complete their guide, you can split this lesson up into 2 days. Day 1 = the video and completion of the guide; Day 2 = Discussion and Introduction to Systems Studies.
3. Guide students through an open discussion. Use the students’ answers to their video guide to guide the discussion. The end goal should be to get students to realize that this is a complex situation, but parts of it are within the realm of scientific research. There is a great deal to study to fully understand both what is happening and to make predictions of how the system and its members will respond. Begin by asking students to share some of their thoughts and worksheet answers. Since the open-ended video guide is less scripted, this lesson is written specifically to those questions. However, a very similar discussion is encouraged when using the more guided student worksheet.
For Question #1 on the open-ended video guide, here are some possible student answers:
| Groups/types of people involved | Ocean organisms involved | Positive aspects of oceans (what the oceans do for the planet) | Problems associated with ocean acidification |
| Scientists, island dwellers, city dwellers, coal miners, fisher-folk (fisherman/women) indigenous populations | Fish, sharks, squid, shrimp, crabs, pteropods, anything with a shell, whales diatoms | Food, beauty, transportation, clean our shores, protect coastlines from storms, regulate climate, provide most of the world’s oxygen | Acidity depletes molecules needed for shell formation, organisms work hard to make shells and lose out on food getting and reproducing, crash of food web |
4. Use questions 2 and 3 (“Write down at least 2 statements that sound like a statistic…that do not include numbers.”) to encourage students to look further into the statements made. Several points made in the video are cited here: http://www.nrdc.org/oceans/acidification/science.asp. Point out that this is a reputable source due to many factors (.org, national longstanding group with references to primary, peer-reviewed articles, etc.). Beginning to recognize what sources are reliable will be helpful in the future when students are researching the types/groups of people involved (stakeholders) and the science that results. Always encourage students to look for primary sources to support their assertions.
5. Use question 4 to help students begin to form their questions. “What information would you like to have in order to fully understand the impact of ocean acidification?” Students may want to know ‘how much acidity is too much?’ or ‘how does CO2 get into the water and then what does it do?’ This question is designed to get students thinking about what they could possibly study in a lab. What is interesting about this situation? What should we study? Do we need to know more about the Carbon Cycle? This is a good point to have students ask as many questions as possible, without stopping to answer all questions. Begin tallying a list of questions that come to students’ minds and ensure students that throughout the unit they will be learning the answers to many of their questions. If students do in fact need a more thorough review of the Carbon Cycle, and specifically, what happens to carbon dioxide as it enters water, these two powerpoints and other videos may be helpful. In addition, please see our Extension Activities section below for links to many other resources to help teach the Carbon Cycle.
A) PowerPoint – Overview of Carbon Cycle (Google Slide | PowerPoint),
B) PowerPoint – Specific Chemistry of CO2 Dissolution. (Google Slide | PowerPoint),
C) Video – This one-minute YouTube video, produced by the North Carolina Aquarium, gives a nice, very basic, pictorial description of what happens to carbon dioxide as it enters a marine system and impacts shelled organisms. (Please note: It is likely best to save the video to your machine so that you can share it with students without viewing the Comment section posted below the video. Several of the comments are not necessarily appropriate for schools.),
D) Video – This three-minute YouTube video, produced by the Alliance for Climate Education, is terrific for all ages and gives both the science and context for ocean acidification
E) Video – There are many other videos and resources that can be found online that quickly describe the process of OA. We have included some in our Cool Finds and Resources page, and will continue to update links within the curriculum. Here are a few more that might be of use:
6. Use the final questions in the handout to bring more human components to the lessons and to brainstorm possible responses to the issue of ocean acidification.
What might be done to reverse the acidification of oceans? (Solving local problems will help maintain ecosystems: restore fish populations, establish marine sanctuaries (protected areas), reduce nutrient pollution in coastal areas. Solving acidification (a global problem) means reducing CO2. Students may give examples such as wind turbines, fewer cars, etc.)
Who do you think should be involved in addressing the problem of ocean acidification? (Students may say “politicians, community groups, scientists, people using the oceans such as fisher-folk or shipping, whales, pteropods”, etc. Student answers to this question may be quite specific or fairly general. When they work on preparing for the Lesson 6 Summit they will be looking at specific stakeholders within a larger context. Since this is a beginning discussion, let all ideas be heard.)
The discussion should end up focusing on 1) the complexity of the situation and 2) the recognition that many diverse “players” really fall into “ultimate” stakeholder groups. While students may insist that ‘whales’ are ultimate stakeholders, remind them about food webs and the importance of plankton in supporting their favorite organisms. For your reference, these are the 4 groups involved in the Lesson 6 summit presentation:
A) calcifying organisms such as pteropods
B) non-calcifying photosynthetic organisms such as diatoms,
C) people of island nations (low CO2 output)
D) high CO2 output nations.
7. Bring students back around to the big picture. If needed, remind them of the articles they read in Lesson 1 and the network they created. Ask students, “Given the Articles Concept Map from Lesson 1, the Carbon Cycle and CO2 learning from Lessons 2 and 3, and the Acid Test video, do you see this situation as something that requires a systems study?” Or reworded, “Does this situation require a systems approach to understand?” Have them explain their thinking as to why or why not. Probing questions for students: does it have many parts that interact, are there any “emergent” properties, are there reverberating effects? What are the important “nodes”? (Node = part) What is interesting and what should we study?
At this point students generally all agree that this is definitely a problem that requires a systems study. They also generally all agree that CO2 is a key node. If they do not see this, remind them more of Lessons 1 and 2 so that they can both see that CO2 is manageable to use in their class and a very important part in this system.
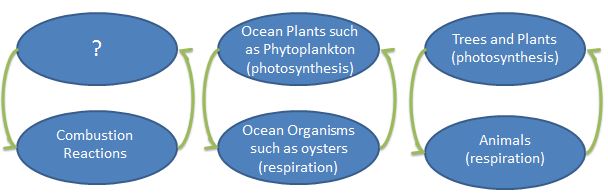
Help them to visualize how CO2 can be part of a systems study by walking them through two different systems diagrams. They will learn more about systems thinking in the next lesson, but this is a good opportunity to introduce something they already know with a systems spin. While at the whiteboard,
-
- First, ask students, “Who is releasing CO2 in this room, right now?” (Us, and any other animals or respiring organisms.)
- Draw a node on the board with the word “Animals” or “Cellular Respiration.” You should use the vocab they understand and are familiar with. Then ask, “Where is that CO2 going? Is anyone taking it in?” (Students should be able to look around and see grass and trees outside or plants in the room to give the appropriate answer.)
- Draw an arrow to a second node with the word, “Plants” or “Photosynthesizers.” Again, connect to the vocab they are familiar with. You may want to remind students that plants also respire, but in order to think about the big picture, you should all remain focused for now on the movement of carbon and energy between the many species that respire and the many that photosynthesize.
- Next ask students, do those photosynthesizers give anything to us?” (Yes! Oxygen.) So can we draw an arrow from plants to animals? (Yes!)
- Then tell students that this is something we are very familiar with on land, but does it also happen in the water? (Absolutely! There are plants and animals in the water. Since the ocean is a huge part of our earth, let’s draw another cycle for our marine photosynthesis and respiration cycle.) Now you should have two cycles drawn on the board (see below for the 2 righthand cycles discussed thus far). Ask students if they think these cycles have been balanced or in equilibrium. (Generally, yes. We use our cycle to make energy for living. Plants store the energy and the cycle has been fairly balanced for some time. For many years this was fairly balanced.)
- But then what happened? We learned how to release a lot of energy through large combustion reactions. Draw a node on the board with the word “Combustion” and draw an arrow up to a blank node. What balances those reactions? What’s the counterpart?
- In most cases, students will guess, “the ocean?” And at this point you are setting the stage saying, yes, that seems to be the case, but what does this mean? Is this a good thing or a bad thing? Can it truly balance these reactions? What else is happening that we’re not aware of? How can we predict what this all means? What are the long-term and short-term effects? Do we have all the answers? (no) Can we study and explore this in our classroom with our resources? (Yes!) It is important that students know these answers are unknown and this is what scientific research is for and what THEY can participate in now.
- Here’s an example of what the final systems diagrams can look like. They’ll see this again in a PowerPoint in the next lesson and will explore more of what it means. However, drawing it out step by step as instructed above will help them internalize these important relationships.
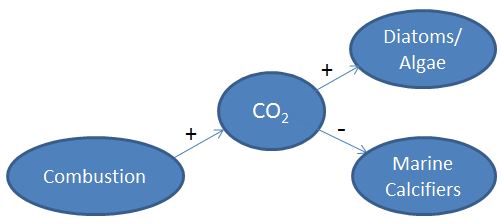
- A second type of diagram that you can draw that may help students with the systems aspects of this is centered on CO2. To walk students through the development of it, begin in a similar way as written above (Who is making CO2? – We are. We are exhaling it and we are emitting it with our energy use, etc.). What has caused a recent increase in CO2? (Industrial Revolution or more specifically, combustion reactions).
- Draw a node with the word Combustion and then draw an arrow from Combustion to CO2. Ask students, “Does Combustion increase CO2 or decrease it?” (Increase) Draw a plus sign (+) next to the arrow to show this relationship.
- Ask students what they think this might result in? At this point, they’ve heard that marine calcifiers may experience negative impacts. Draw a node with Marine Calcifiers in it and an arrow from CO2 to Marine Calcifiers. Then draw an arrow from the CO2 to this node with a negative (-) sign next to it.
- Then ask students, is it likely something might perform well in an increased CO2 environment? Is there anything in the ocean that takes in CO2? (Yes, the plants of the ocean – algae and diatoms). Okay, let’s draw an arrow from the CO2 to the diatoms node with a positive sign (+) next to it.
- Are these relationships known for sure? What about the extent of these relationships? (no) System biology uses diagrams like this to develop hypotheses. These pluses and minuses show possible relationships. Can we test them? (Yes!)
- Is our diagram missing anything? Can we include a node pointing to the CO2 that has a minus by it indicating that CO2 will go down? (this is unknown and the debate of many)
- Here is a pictorial representation. Again, do not just show students this image, but walk them through the steps at the whiteboard to help them understand the process of coming up with hypotheses for systems-level studies. You may also want to walk them through creating a loopy model of this system in order to explore feedback loops and refine their hypotheses before deciding what to investigate in the upcoming lessons.
- First, ask students, “Who is releasing CO2 in this room, right now?” (Us, and any other animals or respiring organisms.)
8. Students should see that there are 4 main groups that emerge from these diagrams. These are all stakeholders. Ocean Acidification is connected to them in some way.
-
- There are the respirators in the ocean who we have heard will be negatively impacted (marine calcifying organisms who cannot make shells as efficiently AND the shells they have dissolve).
- There’s their counterpart, the diatoms who make 1/5th of all the world’s oxygen who we think will fare well, but for how long and will they really be winners?
- Then there are the nations and people who rely on large combustion reactions.
- And there are their counterparts, the islands and other nations that rely on a healthy, pristine ocean for their livelihood.
Tell students: “We are completing these lessons to learn about current science and research and specifically about ocean acidification. Which of these groups would you align yourself with? Who would you like to advocate for? If we were to align ourselves with an interest group, someone we can relate to, who would it be and what would we research? How would we drive our experiments with that interest group in mind? Tomorrow we will begin planning our experiments. Because this is a massive problem and there is much to study, we will model the collaborative research current systems scientists are completing. Today, you will decide who you might like to align your interest with in order to bring the humanistic component to this research.
On a small piece of paper, write your name and list your first and second preference for which of these interest groups you would like to align yourself with. Hand that paper in to the teacher.
Prior to tomorrow’s lesson, group students according to their interest group, forming 8 groups (2 of each of the 4 interest groups). See Lesson 4 for more information.
You completed Instructional Activities. Please move to Assessment via the Tab above.
Assessment
How will I know they know?
- Completed Worksheets and/or Notebook and Discussion Participation:
- Were students able to appropriately complete their worksheets?
- Were students able to appropriately participate in the discussion? Consider a rubric or tally to track student involvement if necessary.
- Were students able to give you two choices for interest group alignment?
Mini-Surveys: As part of our effort to ensure quality STEM learning experiences, we invite you to participate in short, but informative surveys. You can complete one, all or any variation between. Here is a downloadable Teacher Overview to guide you through all surveys.
- A mini-survey is a short survey (1-3 minutes) that students and teachers will use several times over the course of the module. The questions are identical each time, so the same link can be used each time.
- Student Mini-survey link (https://www.surveymonkey.com/r/OA_StudentSurvey). Please provide 2-4 minutes for students to complete the mini-survey while in class. It should take most students one minute or so, especially after the first survey or two (because the questions remain the same).
- When prompting students to take this survey at this timepoint (#2), please remind students that this survey covers information taught over the entirety of Lesson 3. Here is an example prompt for students: Take this mini-survey while thinking of the lessons we completed on [Tuesday through Friday] that allowed you to:
- watch a video and PowerPoint on OA and
- evaluate whether OA is something that requires a systems approach.
(Please remove and replace any necessary text above that helps your students think of what they have completed as part of this module.)
- Please complete the teacher survey while students are taking the mini-survey, or at the end of the day. Please take it on the same day the students take theirs (https://www.surveymonkey.com/r/OA_TeacherSurvey).
- When prompting students to take this survey at this timepoint (#2), please remind students that this survey covers information taught over the entirety of Lesson 3. Here is an example prompt for students: Take this mini-survey while thinking of the lessons we completed on [Tuesday through Friday] that allowed you to:
- Here is the entire Survey Teacher Guide that you can use when implementing these surveys. Thank you!
Resources
- NRDC Video – Acid Test: The Global Challenge of Ocean Acidification
- Student Open-Ended Video Worksheet (Google Doc | Word Doc)
- Student Guided Video Worksheet (Google Doc | Word Doc)
- Teacher Open-Ended Video Worksheet Key (PDF)
- Teacher Guided Video Worksheet Key (PDF)
- PowerPoint – Overview of Carbon Cycle (Google Slide | PowerPoint)
- PowerPoint – Specific Chemistry of CO2 Dissolution (Google Slide | PowerPoint)
- YouTube Video – North Carolina Aquarium’s One Minute Ocean Acidification Description
- Loopy (optional for creating a loopy model for the 2nd systems map with (+) and (-) edges – https://ncase.me/loopy/
Accommodations
Many accommodations are written in throughout this lesson. For instance, using a more guided worksheet or providing more focused work in class may help students internalize these issues more fully depending on their grade level and previous experiences. Also, some classes may benefit from a more loosely structured lesson that simply guides students into advocating for stakeholders. In general, we have found that students are fairly good at identifying the stakeholders. A lesson variation then would be to introduce the problem of ocean acidification, and then begin a “Who Cares?” brainstorm. Students should list as many stakeholders as they can and then the teacher can specifically pull in the stakeholders they had come up with for the final project.  Showing more pictures and images can help many students. The Global Carbon Cycle image at the right, from IPCC Fourth Assessment Report provides a nice way of seeing how unbalanced this system is, which can lead students to thinking about the resultant disruptions in our entire system. Students can have a difficult time grasping the connectedness of our land, atmosphere and water. This NASA model and video provides a way to visualize available data to help students understand the connectedness of an Earth with a disrupted carbon cycle.
For students who have little, or no chemistry background, this 4 minute NOAA video does a nice job explaining the basic chemistry in simple terms: http://www.youtube.com/watch?v=MgdlAt4CR-4.
Extensions
For more Carbon Cycle Activities – this jigsaw on carbon pumps has been used to effectively teach carbon cycling and help students understand ocean acidification and research. It also builds on students’ network and Cytoscape abilities. See the Introduction to Systems Module for more information on network diagrams (Lesson 1) and visualization through Cytoscape (Lesson 2).
- See also the Biological Pump Module from the University of WA High School Climate Science program. It is a great resource to teach students about Biological Pumps. An overview of the lesson’s questions and goals can be found on the Climate Science website. Specifically, the slides from the PowerPoint could be used for students to build a network diagram using Cytoscape. Again, see Lesson 2 of Introduction to Systems for more information on Cytoscape. Also, the PowerPoints on the Climate Science webpage on how scientists use proxies are very helpful for both teacher background information and for teaching students.
If you want students to explore or review pH and they have computer access, ask them to work through one or more PhET simulations listed in Lesson 2. “Intro” is a basic review while the other two have more math emphasis. Or for more options, see: http://phet.colorado.edu/en/simulations/category/chemistry
If students have some chemistry background or you wish to show a more pointed video, see this 8-minute podcast by ‘The Natural Laboratory’. It gives more information on the role of carbonate and a local example of calcifying organisms (oysters): http://www.youtube.com/watch?v=HJa9nwAkUNg.
Students will see aragonite mentioned interchangeably with calcium carbonate. Aragonite is the more soluble form of calcium carbonate that many organisms use. (Calcite is the other form). Here is a site (Woods Hole Oceanographic Inst.) offering a comprehensive explanation: http://www.whoi.edu/main/news-releases/2005?tid=3622&cid=7388. This video is an animation that you can use to see aragonite concentration in surfaces waters over time. http://www.youtube.com/watch?v=qaOwUxrlyvw
Dr. Cliff Law, of the National Institute of Water and Atmospheric Research, talks (7 minutes) about the usual calcifying organisms
http://www.youtube.com/watch?v=Pie0bETip9o but also talks about bacteria being involved in a positive feedback loop which disrupts CO2 capture by increasing (digestive) enzyme activity.
This 13 minute, Tides of Change video (and website) features field scientists at the Olympic National Park in Washington State discussing climate change and ocean acidification. Begin viewing at minute 8.11, for a terrific description of OA (though all 13 minutes are terrific and show the beautiful Olympic Coast). In addition to sharing information about field ecology, climate change, ocean acidification, the delicate balance of life, and how to help, this video also gives a sense of what it might be like to be a field ecologist. For more phenomenal videos of this sort, see WA SeaGrant’s page. Their 2020, Coast as Sentinel: Tribal Communities at the Forefront of Ocean Change video is especially powerful at showcasing the impact of OA in tribal communities.
References
Many teachers and scientists participated in the creation of these lessons and content. Please view the links throughout the module and the list of credits for this work.