Lesson 2 – Great Salt Lake Case Study Introduction
 Description: The students will be presented with a real life example of an event that affected the Great Salt Lake ecosystem – the building of a causeway. Based on observations of this phenomenon, students will generate hypotheses about factors affecting the growth of one prominent organism in this ecosystem, Halobacterium.
Objectives
What Students Learn:
- Observations lead to hypotheses and experimental design.
- An ecological disturbance in a single abiotic or biotic factor could affect an entire ecosystem.
- Natural events and human activities affect the Earth’s capacity to sustain biological diversity.
What Students Do:
- Students use scientific thinking to consider how a disruption in an ecosystem has affected that network.
- Students design a scientific investigation to test how salinity affects halobacteria.
Instructions
Overview
The students will be presented with a real life example of an event that affected the Great Salt Lake ecosystem – the building of a causeway. Based on observations of this phenomenon, students will generate hypotheses about factors affecting the growth of one prominent organism in this ecosystem, Halobacterium. They will then think about how they could design an experiment to test their hypotheses. This will lead to the implementation of an experiment testing the effect of salinity on the growth of Halobacterium.
INTRODUCTION
- Warm-up: Does a change in the environment result in a change in the life residing there? Does this include extremophiles? Why or why not? Give examples in your explanation.
If you want to emphasize vocabulary, use the terms abiotic and biotic in the question.
With the extremophile research fresh in their minds, students may use examples of extremophile populations changing as a result of change in temperature, oxygen availability, etc. Accept all answers, and do not lead the students into thinking about salinity or Halobacterium.
- Introduce students to their Case Study Mission and the objectives for the lesson using Slide 1 (Link to PowerPoint – GSL Case Study.ppt) (Google Slides | PowerPoints):
- Analyze how an ecological disturbance could affect an entire ecosystem.
- Analyze the effect of natural events and human activities on the Earth’s capacity to sustain biological diversity.
Tell students they should use all information they know about life while analyzing the case study, including information learned (from this course and in previous years) about both extreme and non-extreme organisms.
- Present PowerPoint on the GSL causeway to introduce the investigative problem.
While keeping the warm-up question in mind and while presenting the entire PowerPoint, instruct students to write down their ideas in their journals. These will be referred to at the end of the presentation. EXPLORATION OF CASE STUDY
- Present slides #2-6. Have students discuss and record the differences they note in the pictures presented in slides 4-6.
- Slide 2: Case Study Details
- Slide 3: Specifics about Case Study
- Slide 4: Picture showing the North (Purple) and South Arms of the Great Salt Lake. Do not reveal it is the Great Salt Lake at this point; only refer to it as a body of water. The color differences in the lake are important for the students to notice. However, this slide, along with slide 6, may be difficult for students to see depending on your classroom and screen. If there is glare or any other obstacle in viewing this, explain the differences in color to the students.
- Slide 5: Picture of the railroad and causeway over the body of water. Students can note differences in the two sides of the causeway.
- Slide 6: 1984-Body of water in non-drought conditions; 2004-Body of water in drought conditions. Be certain to click through all items on the slides to show a comparison of the water levels. Encourage students to carefully observe all of the differences between the two pictures.
- When you get to slide 7, go slowly through the brainstorming questions, one at a time. As students offer suggestions, write them down in order to encourage active participation, inquiring questions and thoughtful ideas.
- Feel free to scroll back to the picture (slide 6) while they’re brainstorming.
- While they’re answering the second and third brainstorming questions, lead them to understanding that a change in the environment often results in a change in life. (Remind them of their warm-up question)
- After probing the students to give many possibilities, ask them what other information would be helpful. These are things that you can come back to at the end of the presentation if needed. After they have requested a variety of information, share slide 8 with them.
- Encourage them to think of as many possibilities as they can for the questions on this slide (i.e. an industrial plant is dumping freshwater into the side of the water they are near, half of the water is in a different weather pattern, one half has a freshwater spring, etc.). The correct answer: only one arm has rivers feeding into it. Without giving the answer, have them try to answer the remaining questions on slide 8. Use the brainstorming questions to guide their thoughts towards aquatic salt ecosystems that can be found on Earth.
- If only one side gets freshwater, then there are only a few options.
- This water ecosystem is a large puddle and will probably dry up eventually. If they assume this, ask if this is a likely situation given that previous information states the body of water has been around since at least 1902.
- This water ecosystem is either a small sea or a saltwater lake that is fed only on one arm by freshwater rivers.
- This water ecosystem was created by the damming of a river. Ask the students if this is likely the case after looking at the previous pictures. (No dams are apparent).
- After going through any possibilities, they should be able to see that option #2 makes the most sense. If students are struggling with identifying this as a saltwater ecosystem, revisit slide 6 and discuss what more or less water may do to any sample of water (dilute solutions).
- Lead them into brainstorming about the last question. This should further bring them to the idea that the concentration of the salt varies in the north and south arm. Ask them: How would the amount of rainfall received affect the life growing in the ecosystem? Is living in a high saline environment friendly or unfriendly? Are we able to live in this environment? Why or why not? Is it healthy for us to drink salt water?
The questions asked should lead them into the idea that a high saline environment is one that most “typical” life cannot live in.
- Show Slides 9–14 and discuss with students how other organisms are affected by living in a salt water ecosystem.
- Slide 9: 3 vials of E. coli, grown at 37°C for 4 days–the cloudy one had no salt lots of growth; high salt no growth
- Slide 10: Radish seeds watered with varying salt only no salt germinated
- Slide 11: Ivy one watered with freshwater the other with highly concentrated salt water (the dead one received salt water)
- Slide 12: Microscope image of a red onion cell
- Slide 13: Image of the same cells with salt added plasmolysis occurs
- Slide 14: same as slide 12
- Bring them back to the original question, Why do the two sides look different?
- Show them Slide 15 which tells them the body of water in question is the Great Salt Lake. This also shows them the food web. Slide 16provides questions that will help them further brainstorm and explain possibilities as to why the two arms look so different.
- Students should observe that while there is a robust ecosystem in the south arm of the lake, the north arm has very little species diversity. The prominent organism in the north arm is Halobacterium. (The north arm of the lake is a red color.) It may be helpful to have a printed copy of the food web on Slide 15 for them to look at while they work towards answering the questions on Slide 16.
STUDENTS FORM A TESTABLE HYPOTHESIS AND DESIGN INVESTIGATION
- Students Design Experiment: Use slide 17 as a way to lead them into designing an experiment that will test whether or not Halobacterium can grow in a high saline environment.
Ask the students to think about what factors may affect Halobacterium. They should write these down in their lab book or journal. Possible student answers may be the amount of oxygen, sunlight, salinity, pollution, etc. If students only offer the idea of salinity, encourage students to brainstorm other factors that may affect Halobacterium.
*It is very important to record and keep the list of class hypotheses. Students will revisit this list and design experiments to test these hypotheses as an assessment following the investigation.
- Focusing on the idea of salinity, ask the students how they think salinity may affect the growth of Halobacterium. Students will form a testable hypothesis answering the question.
While emphasizing the need for evidence to support their hypotheses, ask the students how they could test the effect of salinity on the growth of Halobacterium. What are the variables? How would they go about testing their hypothesis? What controls would they need? How would they set up the lab?
- The students should generate a detailed procedure on how they would test their hypothesis. Note: In the students’ procedures they can use the term “measure” in a general format when referring to measuring the growth of Halobacterium. At this point they have not been introduced to the spectrophotometer.
Teacher Options: Depending upon student skill level, the teacher may choose to informally assess or not asses the student’s proposed procedures. Teacher may opt to have students design procedures as a whole group, small groups, or individually. This portion of the lesson should not take up too much of the overall lesson time.
Use the experimental design prompt (Google Doc | Word Doc) to guide students. The experimental design grader.doc (Google Doc | Word Doc) can be used to assess students procedures.
- The actual, optimized lab should be presented on the next class day. Please see Lesson 4- Conducting halo salinity on potential lab set ups.
Teachers please NOTE – If you are interested in an alternative scenario, there are many in a variety of locations and time frames. Halobacterium has been popping up in the news for years in many geographic regions as an indicator for salt intrusion and drought (two situations on the rise). Check out these two stories that can offer alternative scenarios that would still work with the lessons of this module.
i) A Here and Now Story was released by NPR on November 7, 2023 – “Collapse of Utah’s Great Salt Lake is ‘so close you can feel it.'”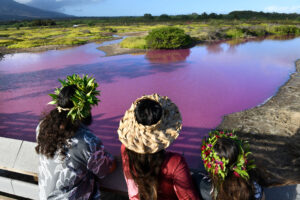
ii) On November 11, 2023 the New York Times featured a lake on Maui that turned pink. Prior to this, on November 8, 2023 many pictures were shared via social media throughout the region. People originally thought it was a toxic algae bloom, but people who are familiar with salt water systems and/or Halo were quick to recognize their characteristic bubble gum color.
You completed Instructional Activities. Please move to Assessment via the tab above.
Assessment
How will I know they know…
- Collect the student journals to view and evaluate their hypotheses and procedures. The experimental design grader worksheet (Google Doc | Word Doc)
- can be used as a rubric.
Resources
- PowerPoint: GSL Case Study.ppt (Google Slides | PowerPoints)
- experimental design prompt (Google Doc | Word Doc)
- experimental design grader.doc (Google Doc | Word Doc)