Curriculum Modules

Environmental Influence on Gene Networks
Unit Plan & Lessons Flow Chart Printable Overview Contributors
In this module, students complete the steps scientists take when using systems biology to investigate how organisms induce phenotypic changes in response to the environment. Student teams apply their background knowledge of genetics and networks to experiment with a model organism. They then exchange and interpret information in order to build a possible network, and in the laboratory, test this network by altering environmental conditions. This leads to further experimentation to verify and draw conclusions about network interactions using experimental data and a computer simulation. Students act as scientists while planning, implementing, and evaluating an investigation in the context of a real regulatory network.
Lesson 2 – Growth and Phenotypic Response of Halobacterium in Different Environmental Conditions
Benchwork, experimentation in the lab
The exploration of the genetic control of networks begins as students go into the laboratory to test how gene expression in Halobacterium changes in response to environmental conditions. Surprisingly, students observe that the cells, typically pink in color, experience a phenotypic change when grown in the presence of a full spectrum light bulb and when grown in the absence of all light. The cells grown in dark conditions turn nearly white, whereas cells grown in the presence of light turn a deep purple color.
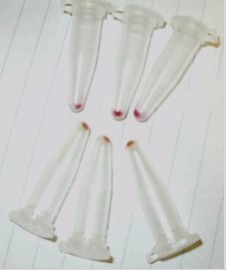
Students also notice that the amount of cell growth increases when a full-spectrum light bulb is used. After learning that bacteriorhodopsin (bR), a protein found in the Halobacterium membrane, is purple, students begin to suspect that the genes for bR might be turned on in the presence of light and turned off in the absence of light. After gathering and graphing all of the class data using Excel, they induce that as the amount of light increases, so does the amount of bR. However, they find they do not have enough information to verify this, which sends them in search of more evidence to answer the question, “How might Halobacterium cells change the amount of bR in response to light?”
Lesson 3 – Data Analysis to Propose Network Function
Collaboration with other experts to thoroughly analyze multiple types of available, pertinent data.
Networks of genes and proteins allow cells to change gene expression in response to their environment. Just as scientists use this premise to infer or build models of cellular networks by analyzing and integrating multiple types of data, the students likewise use actual data to piece together a network in order to answer their question discovered through experimentation. Each student analyzes one of three types of data using given background information, actual homology, metabolic or microarray data, and a worksheet to guide their analysis. The student then joins a pre-assigned group to teach each other about their data and information. Together the group uses all of their new understandings to pencil in a possible bacteriorhodopsin network. Because this would not be possible with only one type of data, this displays the significance of compiling multiple data sets from various experimental techniques when suggesting network relationships. The data also gives the students the opportunity to look past complex names to see molecules as items that simply interact. They represent these molecules as symbols, or nodes, in a network and begin to visualize how a set of proteins and genes function as a unit to give rise to a set of properties within a cell. Specifically, they learn about growth and energy production in response to changing the environmental conditions of light and oxygen; in general, they learn about systems concepts along with the importance of both gene regulation and surviving in a variety of environments.
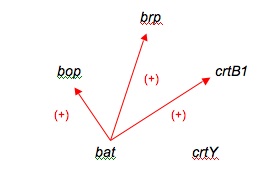
One of the beginning networks after looking at only microarray data.
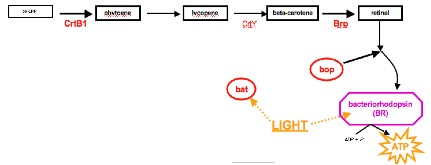
Final, class compiled bR network.
License
![]() Except where otherwise noted, the Environmental Influence on Gene Networks module, copyright Institute for Systems Biology (ISB) through Baliga Systems Education Experiences, is available under a Creative Commons Attribution-NonCommercial 4.0 International License. All logos, trademarks, and videos are property of their respective owners. This resource may contain links to websites operated by third parties. These links are provided for your convenience only and do not constitute or imply any endorsement or monitoring by ISB or ISB’s funding agencies. Please confirm the license status of any third-party resources and understand their terms of use before reusing them.
Except where otherwise noted, the Environmental Influence on Gene Networks module, copyright Institute for Systems Biology (ISB) through Baliga Systems Education Experiences, is available under a Creative Commons Attribution-NonCommercial 4.0 International License. All logos, trademarks, and videos are property of their respective owners. This resource may contain links to websites operated by third parties. These links are provided for your convenience only and do not constitute or imply any endorsement or monitoring by ISB or ISB’s funding agencies. Please confirm the license status of any third-party resources and understand their terms of use before reusing them.