Lesson 2: Cytoscape cell phone network
Objectives
See the NGSS listed in the left-hand menu. When applicable, connections to 21st Century Learning Skills and other published standards are also included in the chart below. In addition, for this lesson, here is a breakdown of:
What Students Learn
- Scientists use computer programs to analyze networks because networks are often very complex.
What Students Do
- Students use the computer program Cytoscape to analyze the cell phone network.
Instructions
Introduction and Warm Up
Warm Up Idea: list at least 2 ways in which your cell phone network from yesterday could be altered or “messed up”. Hint: think of things that might happen that could change who could call who.
Goal: get students thinking about the cell phone network again, and get the students thinking about how changes in a network will impact how a network will function. The cool thing about Cytoscape is that students will be able to make these big system changes and run simulations to see what the impact is.
Possible student responses: add a phone number to your phone book, cell phone dies so you can’t call your friends, drop your cell phone and break it, can’t get a signal, lose your friends phone numbers, etc…
If you did the homework assignment (create your own challenge question), have students pass in 3×5 cards now which have the questions on them. You can shuffle them and re-pass them out to students to answer while they are in the computer lab.
What is Cytoscape?
Show PowerPoint on Cytoscape and networks to show the program we will be using (Network Examples in Cytoscape.ppt)
Today the class will be using a computer program that is used in real-life biology research labs in order to study the interactions within networks. It will allow us to answer complex questions about complex networks.
Slides 2-4 show how food webs, something students are familiar with, can be written in network format with clear nodes and edges. Slides 3 & 4 show networks that have been created by teachers using the Cytoscape program.
Slide 5 shows the cell phone network which the students made yesterday- it will probably be much neater, more organized, and easier to read than what students could come up with on paper.
Slides 6-7 show some applications of this software and how it is used in research labs. Networks can be REALLY complex! We hope to use this software again when we talk about genes and proteins in this class.
To further our goal of bringing current science into classrooms, scientists and programmers have adapted Cytoscape for student use. Typically, Cytoscape is used to visualize and integrate molecular interaction networks with various data, such as gene expression profiles. In our cell phone simulation, students have the opportunity to use this program to model and interrogate the structure and properties of a cell phone network. This familiar subject helps to illustrate numerous ideas about biological networks. To access all of the curricular materials used with this simulation, please click here or continue reading below for information on just the Cell Phone Simulation Lesson (Lesson 2 of An Introduction to Systems).
To run the cell phone simulation, please click here. If the file will not load, try these troubleshooting techniques:
1. Use an alternate browser.
2. Ensure you have Java installed. Please note that this file is meant to run as a Java Applet through an internet browser. The program Cytoscape is not needed to run this file.
3. Update your permissions to allow baliga.systemsbiology.net to download to your machine. Your security settings could be preventing the file from opening.
If you previously ran the cell phone simulation successfully and attempted all of the above, but now the simulation menu did not load, try to run this alternate program. If you are having difficulties – please email us (cludwig@isbscience.org). We can quickly send you a file that will work if there are any issues with the links above. To ensure the file will work, please email us with the following information: 1) the type of device you are using (PC, Mac, tablet, phone, etc.), 2) what browser you are using, and 3) the error message you received.
Terminology
This simulation uses everyday technology (cell phones) to illustrate ideas about networks in biology. The picture of the interconnected phones is called a graph or network. Each circle represents (in this case) a cell phone, but it could represent any entity, including components of a food web or genes and proteins. The generic name for these circles (which are not always circles), no matter what they are representing, is nodes. For the purposes of this simulation, the terms node and cell phone can be used interchangeably. The lines that go into and out of each node are called edges. The edges in this graph have arrows which means they are directed edges, and that signals can only move in the direction indicated by the arrow.
To knock out a node means to remove its edges, so that no signals can originate from or move through the knocked out node. To reactivate a node means to restore its edges.
This Terminology is pertinent to both the Java-based and browser-based and cell phone simulations. The pictures below are taken from the Java-based simulation. However, the commands and actions can be used in both the Java-based simulation and the browser-based simulation. The browser-based simulation is more intuitive and we encourage you to use the same ideas to achieve the same end result. Photos for the browser-based simulation will soon be available within the browser-based app.
The Simulation Menu
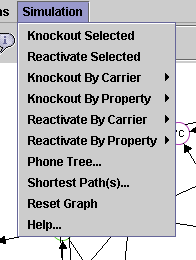
The Simulation menu is the right-most menu in the menu bar. It contains virtually all the commands you will use. The first five menu items are concerned with knocking out and reactivating nodes or groups of nodes. If your window does not contain a Simulation menu, close the program and reload it. If the menu continues to not load, please try running the program with a different web browser (i.e. If you were using Firefox, please try Explorer.).
For the browser-based cell phone simulation, all needed commands are located directly on the header of the web application.
Each phone has several properties and capabilities. It has a name/phone number, such as “3E.” It also has a carrier (service provider). Different carriers are indicated by the node border colors. Also, each phone may have one or more of the following capabilities: email, picture, and roaming.
Below is a description of how to knock out all selected nodes. Then you can select and deselect nodes and experiment with the “Knockout Selected” and “Reactivate Selected” menu commands.
Knocking out phones by carrier or by capabilities is even easier. Say that you want to send a picture to everyone in the network–everyone, that is, whose phones can receive pictures. First you must knock out all phones that do not support picture capability. The menu command for that is: Simulation/Knockout By Property/Phones Without/picture.
Whenever you knock out a phone or group of phones, there is a corresponding reactivate command. But if you forget what you knocked out, you can always reactivate the entire network by choosing the “Reset Graph” menu command. The “Help” command pops up a web browser with this page. The “Shortest Path(s)…” and “Phone Tree…” commands are discussed below.
Finding the Shortest Path(s) Between Two Nodes
The “Shortest Path(s)…” menu command pops up the following dialog:
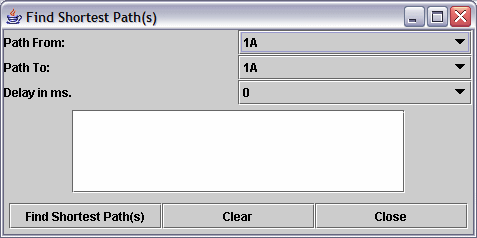
As you might imagine, this dialog allows you to determine the shortest path(s) between two nodes. Remember, each phone can only call the other phones in its phone book (the ones its outgoing edges point to), so you can’t just draw the shortest line across the network.
Say the shortest path between A and B is 3 edges long. It is still possible that there is more than one 3-edge path between A and B (this is in fact the case with 1A and 7E, though the path is longer). This dialog will display all the shortest paths, but will only animate the first one.
To use the dialog, choose the beginning and the end of the path in the appropriate dropdown lists. Then click “Find Shortest Path(s).” The nodes and edges will turn red as the path is followed, and the text box in the middle of this dialog will display the number of edges traversed in this path. You can select an optional delay (in milleseconds) that will occur before drawing each edge.
The “Clear” button will remove the red coloring from edges and nodes so that you can try another path. For example, you might be experimenting to see if there is a path between 2E and 4E. You try it and see that yes, there is a path of 5 edges between them. Now press “Clear” to reset the nodes and edges along the path to their normal color. Then you go to the graph (while leaving this dialog open) and knock out 2A (click on 2A, then choose Simulation/Knockout Selected). Go back to the dialog and click “Find Shortest Path(s)” again. This time it takes a different path, avoiding 2A–this path is one edge longer. You can repeat this process indefinitely, knocking out and restoring nodes in order to change the path taken, or to see if there still is a valid path. Click “Close” when done with this dialog (note that any path animation that may be occurring will continue despite closing the dialog).
Phone Tree
The “Phone Tree…” menu command pops up the following dialog:
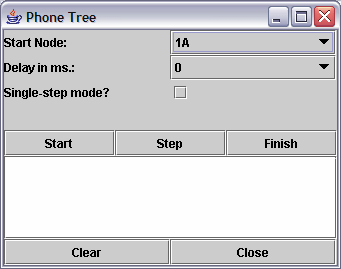
The Phone Tree is a way to propagate messages across the network. You choose a starting phone, then that phone calls every phone in its phonebook, those phones call every phone in their phone book, and so on, until everyone who can be called is called. The behavior of the phone tree can be changed and constrained by knocking out and reactivating nodes in the network.
The simplest use of the dialog is just to pick a starting node and press “Start.” You will see the phone tree in action. The text box in the center of the dialog fills with information about who is calling who. When all possible calls have been made, another dialog pops up telling you who made the most (and least) calls and who received the most (and least) calls. It also tells you the total calls made and received.
You can also specify a delay in milliseconds to occur between each step of the phone tree. That will make it clearer who is calling who.
You can also step through the phone tree one step at a time if you check the “Single-step mode?” checkbox. Then press “Start”. That will execute the first step. To execute subsequent steps, click the “Step” button. (The delay is ignored in single-step mode). If you don’t want to keep stepping through manually, you can click “Finish” and the phone tree will be completed automatically using the delay you have set.
The “Clear” button behaves like it does in the “Find Shortest Path(s)” dialog. It allows you to reset the state of the graph so you can try another phone tree without having to close and reopen the dialog.
A couple things that you may find slightly confusing:
- The “Step” and “Finish” buttons are not used except in single-step mode.
- When running the phone tree with a delay, it may appear that text box messages keep popping up well after the phone tree is completed. This is not the case. Oftentimes, the tree must traverse edges that have already turned red, so the progress of the tree can be invisible during those moments. For a better idea of when the tree will end, keep an eye on all edges that have not yet turned red. When they all turn red, the tree has ended and the text box messages will stop.
Experimentation with the phone tree is encouraged, particularly in conjunction with knocking out various sets of nodes.
Selecting Nodes in Cytoscape
To select a node, simply click on it. Its background color should change to gray. Nodes and edges are often close together or overlapping, and edges can be selected too, so be sure you are clicking on a node, not an edge.
To select additional nodes, hold down the Shift key while you click on them.
To quickly clear your node selections, just click on any empty area of the graph.
To select all nodes, clear your selection as described above, then type Control-V. (Technically this “inverts” your selection, meaning nodes that were not selected before are now selected, and vice versa.)
Another way to select a group of adjacent nodes is to use your mouse to drag a box around the adjacent nodes. You can then type Control-N to display the selected nodes in a new window as a network of their own. You can run all the simulator tools on this sub-network. Sometimes, however, if a lot of dialog boxes and network windows are open at the same time, it can be confusing to keep track of which dialogs go with which networks.
For more information about selecting nodes and other Cytoscape capabilities, please see the links in the next section.
Further Resources
- As an extension to this Cytoscape Simulation, students can use the actual Cytoscape program. Students are often able to guide themselves through using the full program after completing the above activities. However, here is a manual, based on Cytoscape version 3.0, to increase ease-of-use.
- The curriculum surrounding these lessons within an ecological context for high school students: Ecological Networks.
- Complete Cytoscape documentation, including tutorials (aimed at scientific users)
Networks in Biology
Baliga Group @ Institute for Systems Biology and Bellevue School District (BSD).
Supported by a grant from the National Science Foundation (0313754) to Drs. Nitin S. Baliga and Leroy Hood as well as financial support from the BSD.
Contributors
See Contributors page for complete list
Simulation model: John Thomson*, Sarah Nehring+, Dan Tenenbaum, Paul Shannon
Laboratory experiments: Gregory Alvarado*, Stephanie Gill*, Megan Meislin^, Claudia Ludwig+, Jeanine Sieler+, and Marc Facciotti
Handbook: Simin Marzanian+, Camille Scalise+, Claudia Ludwig+, Jeanine Sieler+, Sarah Nehring+
Outreach: Patrick Ehrman (ISB) and Kathee Terry (BSD)
Project Leader: Nitin S. Baliga
*=High School Student Interns; +=High School Teachers; ^=Undergraduate Student Intern
Career Connection
Assessment
How will I know they know
Cytoscape Questions: student should be able to answer questions by manipulating cell phone simulation. Monitor student progress in computer lab: if the simulator is working, you should see nodes changing color from white to red as messages are passed through the network.
Resources
- Cytoscape Instructions.doc (Google Doc | Word Doc)
- Network Examples in Cytoscape.ppt (Google Slides | PowerPoint)
- Cytoscape Cell Phone Questions.doc (Google Doc | Word Doc)
- Cytoscape Questions Teach KEY.doc (Google Doc | Word Doc)
- Non-Java Version Simulation and Documents (post June 2017):
- Post 2017 Cytoscape Simulation Teachers’ Guide (Google Doc | Word Doc)
- Post 2017 Cytoscape Simulation Student Worksheet (Google Doc | Word Doc)
- Link to Browser-Based Application – http://cellphonesim.systemsbiology.net/
Extension
Have students create their own networks using Cytoscape.
How to make a network in Cytoscape.ppt If more guidance is needed for students to research their own network than given in the above PowerPoint presentation, provide students with possible networks to research, such as the African Savannah, Arctic Tundra, etc. Here is a possible guide: Making your own food web. For more on these types of activities, see Lesson 6’s Activity 1.
Also, the Extension Activity document listed in Lesson 1 can be completed after this lesson, instead of after Lesson 1 if more information on Bioinformatics is desired.
Also, encourage students to download and use the actual Cytoscape program (http://www.cytoscape.org). This is free, open-source software used by research labs throughout the world. Based on what they learned in this lesson, they should be able to use Cytoscape. However, for more information, here is a manual (based on Cytoscape version 3.2.0 and written in January 2015) that can help guide students through using this program based on the content in this lesson. Or there is an updated manual built into the Cytoscape program that works well and is maintained and monitored by the Cytoscape Team.