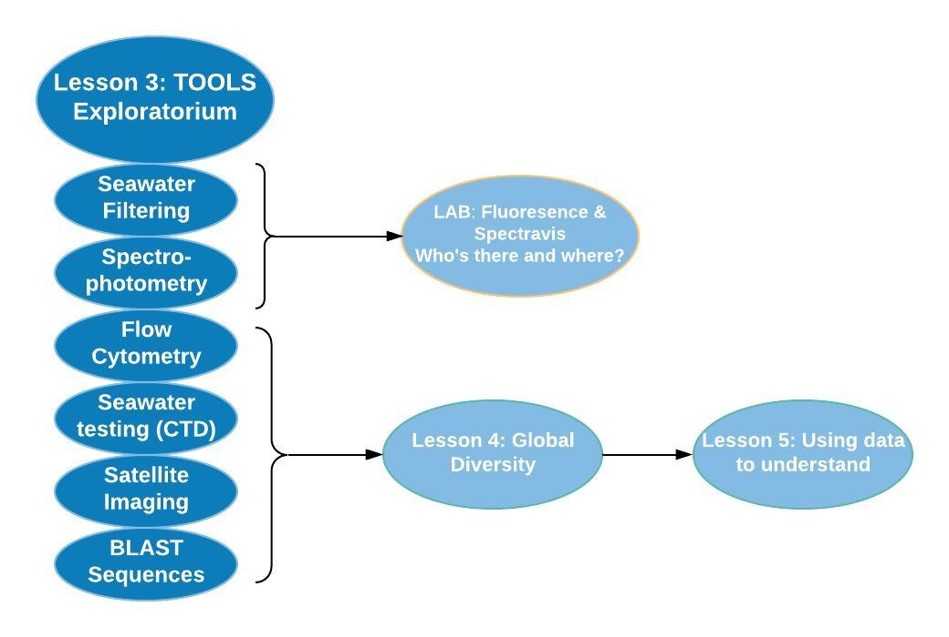
Lesson 3 – Tools of the Trade Exploratorium: Collecting Oceanographic Data From Where We Cannot See
 Description: Students deepen their understanding of Earth’s systems and develop an understanding of how explanations are built from data when they see how scientists use the tools in the field. Six stations will help students learn how oceanographers measure and collect data from where we cannot be or see using both basic and advanced technological tools.
They will apply the information learned in this lesson to piece together that the ocean has layers that form unique ecosystems with chemical and physical variations dependent on the atmospheric conditions and the depth of the layer. Each layer supports microbes with genetic characteristics and variations that allow you to make comparisons. Energy transfer and nutrient cycles support interdependent species and create niches in the ocean ecosystem. Variations in niches lead to differences in genetic makeup.
Objectives
See the NGSS listed as buttons in the left-hand menu and in the chart below. The buttons on the left are grouped to show the integrated three-dimensional nature of our lessons and modules. When applicable, if NGSS are addressed outside of bundles, they are listed separately. Connections to 21st Century Learning Skills and other published standards are also included in the chart below. In addition, for this lesson, here is a breakdown of:What students learn
- How measurements are collected at the scale of both surface and deep ocean
- Technical tools are available to collect data from the simple cultured in the lab-scale to the larger global scale
- Data can be used to compare environmental conditions that influence homeostasis in ocean phytoplankton and other populations
What students do
- Explore and define the different tools for measuring and collecting evidence about ocean microorganisms, and the ocean ecosystem (small and large scales)
- Use models of BLAST bioinformatics and flow cytometry to explore ocean phytoplankton diversity
| Aligned Washington State Standards (Next Generation Science Standards) | |||||||||
Performance expectation(s): HS-LS4-1: Communicate scientific information that common ancestry and biological evolution are supported by multiple lines of empirical evidence; HS-PS4-5: Communicate technical information about how some technological devices use the principles of wave behavior and wave interactions with matter to transmit and capture information and energy
Common Core: M1, M2, E1, E2, E5, E6 CTE: Depending on level of interaction with the tools, this lesson has many potential applications to learning 21st Century skills. STEM application, skills building, engineering design, problem-solving *Depending on level of interaction with the tools and opportunity to design, this Practice can be met when combined with Lesson 4, where data collection and analysis is fulfilled. Working in teams it can build communication and collaboration, information media/technology and life and career skills. The connections to content in the module helps build environmental literacy, engineering design, problem-solving, and global awareness. |
|||||||||
Overview
Introduction
How can you measure the things you cannot see? If land vegetation dies off how will our oxygen be generated? Is it enough to continue to support life on Earth? It is challenging to “see” both very small, and very big things—from the tiny Prochlorococcus introduced in Lesson 2, to all ocean phytoplankton that produce fifty percent of the world’s oxygen. The “Exploratorium” introduces the world of discovery of oceanographers’ Anne Thompson and Sally Chisholm. The six hands-on stations explore the current technological tools that oceanographers, biologists and physical ocean scientists use to study the dynamic ocean and living organisms. The Exploratorium shows how they can measure what “we cannot see” at global scales. Students deepen their understanding of Earth’s systems and develop understanding of how explanations are built from data when they see how scientists use the tools in the field. It is a good way to introduce genetic diversity, evolution, or a deeper study of genetically diverse microbes. After this lesson, use Lab 3.5 to experience the phenomenon of phytoplankton fluorescence as a tool for measuring chlorophyll distribution. Later, in Lesson 4 and the more advanced Lesson 5, apply knowledge of these tools through data-driven activities that exemplify oceanographic research of the Invisible Forest.
All the tools introduced in the “Exploratorium” are referred to throughout the Module. PLEASE NOTE – we are field testing both in-person and virtual versions of this lesson. Please refer to this spreadsheet (or use this link – https://tinyurl.com/u6ylcqm) for a compilation of all links and updates. We will also update this lesson webpage and information as materials are finalized.
| BEFORE CLASS PREPARATION |
- For in-person learning, set up the progressive series of 6 stations in advance, gather materials and print out the cards.
- Tools of the trade: Exploratorium stations – This PowerPoint gives an overview of the stations for teachers and students. This teacher background handout gives an overview of oceanography and biological measurement tools.
- Tools of the Trade HOW TO SET UP – This document provides instructions for setting up the stations. Make sure to organize stations by scale and focus (eg microscope to satellite imagery). When stations are visited sequentially it helps scaffold learning. If non-sequential, connections can be made during review.
- Print out 1 per student:
- Pre-assessment,
- Activity 1-3: Tools of the Trade — How will we monitor and protect the ocean?
- Tools of the trade – Exploratorium Stations Organizer (or use this PDF for easier printing), and
- Tools of the Trade: Story of Discovery (Google Doc | Word Doc)
- Print 1 set per group of 4 students:
- (optional) Collect 1 liter of fresh or saltwater diatoms/phytoplankton from nearby water source (see Lab 3.5 Phytoplankton Spectrophotometry Lab for more information).
- For remote/virtual learning there are two options to choose from. One is fully teacher-led and the other starts as a teacher-led activity and then students finish moving through the stations with a partner.
- For both options, you should start the lesson as written with Part 1 (see instructions in table and text below). For remote classrooms, we recommend using the Pre-assessment and the NOVA Video: “Earth from Space” (show from 1h13m to 1h23m – on PBS, on YouTube).
- Then for Part 2 (the Stations Activity) decide if you’d like the fully teacher-led option or if you want to get them started with the Stations and then have them complete them with a partner.
- Fully Teacher-Led:
- Use this Teacher Version of the presentation – the slides are what students will see, but the notes are different. Use this Teacher KEY for [Virtual] Tools Explorer Organizer.
- Students will need two files – students should make a copy of each (or download it as a PowerPoint) and use it as their own copy to take notes on:
- Teacher-Introduced with Student Completion in Partners:
- The [Virtual] Tools Exploratorium Webquest Teacher Resource has introduction materials, keys and further background for each station. Here is the Teacher KEY for [Virtual] Tools Explorer Organizer. Please note, this includes all of the same content as the in-person classroom lesson, but may be reworded with different prompts that are more suitable in remote or hybrid contexts.
- Fully Teacher-Led:
| PACING CONSIDERATIONS – Use this document to Optimize time if you are considering combining Lab 3.5 with these exploratorium stations |
Table 1 – Overview of Instructional Activities
(Please note – Full instructions are BELOW this table. The table provides an overview with a few key links for your reference):
| Activity | What students learn | What students do |
| Part 1: Introduction Activity (~10 min) Use one or both of these two options to introduce this lesson:
1) Use NOVA Video: Earth from Space (on PBS, on YouTube) (~10 min.) and/or 2) Activity 1-3 Tools of the Trade — How will we monitor and protect the ocean?, (+10 min.) with (optional) Explorer Question CARDS and Explorer Questions -sorting organizer. |
– What and where we measure matters
-There are different types of data measuring tools in oceanography |
– Make observations of ocean phytoplankton, recognizing differences in scale.
– Compare ocean research questions and the scale data is collected and measured |
| Part 2: Stations Activity (~30-40 min)
(Advanced Prep – Use Tools of the Trade HOW TO SET UP prior to class to organize the stations. For more information, here is the Tools of the Trade Organizer KEY) ACTIVITY – Tour the classroom Tools of the trade: Exploratorium stations with Tools of the trade Exploratorium Stations Organizer (in PDF) FOR REMOTE classrooms: Use one of the two options listed below or above for the Stations Activity.
|
– How measurements are collected at the scale of both surface and deep ocean
– Technical tools are available to collect data from the small cultured in the lab scale to the larger global scale. – Data can be used to compare environmental conditions that influence homeostasis in ocean phytoplankton and other populations |
– Explore and define the different tools for measuring and collecting evidence about ocean microorganisms, and the ocean ecosystem (small and large scales)
– Use models of BLAST bioinformatics and flow cytometry to explore ocean phytoplankton diversity |
| Part 3: Assessment (~20-30 min) How will I know they know…
Use Tools of the Trade: Story of Discovery about Sally “Penny” Chisholm [winner of the 2019 Crafoord science prize]
[Field test option] End with Video: Annenberg Learning —Unit 3: Oceans//Section 1: (min.13-15) – Or use PBL reflections ‘Know /Need to know’ and PBL summary table to add to ‘Drop of Seawater’ art projects |
– What do I know now?
– Tools can be applied and combined to develop deeper understanding of phytoplankton populations and the oxygen they produce – [PBL option] Making connections and seeing relationships in Drop of Seawater. What questions do I still need/want to ask? |
– Fill in the blanks to demonstrate an understanding of how to apply the tools in a real-life story.
– Discuss ‘big picture’ questions as a class. – [PBL option] Conduct reflection and ask new questions by adding to ‘Drop of Seawater’ art project. |
Instructions
Teachers, please note – this page gives you the instructions for leading students through this lesson. Prior, you will need to set up your classroom. See the “Overview” Tab to view all necessary Advanced Prep Steps.
As the lesson unfolds, you will be taking students from the very small microscopic scale to the very large macroscale, asking them how to think about, to measure and to answer questions about the deep ocean.
Step 1: Introduce the Essential Question(s) using NOVA Video: “Earth from Space” (show 1h13m to 1h23m) OR the first three slides of: Tools of the trade: Exploratorium stations powerpoint. Follow up the teacher-led discussion in the PowerPoint with: Activity 1-3: Tools of the Trade — How will we monitor and protect the ocean? Ask them to Pair-share, then write in lab journals.
Activity 1 (1 min): Ask What does the ocean do for us? Observe and compare [slides 1 and 2] the two images [at different scales] in the PowerPoint. Also, (this is optional and would take more time) if you have two samples of water containing tiny aquatic organisms such as diatoms, have them compare these samples either by eye or under a microscope. As learned in Lesson 2, phytoplankton abundance and scale are varied, we are going to study them in macro-scale as well as nano-scale. One kind of ocean data is ‘Observational’ data, as you see in these slides.
Activity 2 (1 min): Ask Does it matter what we measure? Students are introduced to the questions of measuring at both very large and very small scales by briefly sorting the Explorer Question CARDS using Explorer questions – sorting organizer.
Activity 3 (3 min): Does it matter where we measure? As students observe the two satellite images (‘remote sensing’) it gives them a first glimpse of the macro scale and global observation. Ask What other ocean data is available? Write a list of their ideas on the board. Ask as formative assessment: Do satellite images provide measurable data? quantity? Stop here. [The remaining slides in the PowerPoint are printed out to be displayed as information at each station of the “Tools of the Trade: Exploratorium”.]
Introduction: Tell them they are about to enter the “Tools of the Trade: Exploratorium” a self-guided experience—a mini science center.
Step 1: Divide students into groups of 2-3 and start each group at one of the 6 stations to begin their exploration. Along the way, they can discover how oceanographic data collection is possible with current technology.
Step 2: Ask them to think about this Focus question: How are we going to protect, manage, and monitor changes in the ocean system? What evidence would you collect to answer your investigation questions [either their own PBL questions or ‘Explorer questions’]? We can collect cells living in a drop of seawater. How do we know how many and what kind of cells they are? Give them a little background for how they will apply their learning later:
The tiniest Prochlorococcus, was discovered only in the last 30 years, because new technology allows oceanographer Sally “Penny” Chisholm PhD [winner of the 2019 Crafoord science prize] to “see” the cells that are 5000 times smaller than a chloroplast. Others like Anne Thompson, PhD continue to ask new questions and make discoveries. What tools do oceanographers use to learn about these cells on the larger global scale and the very small scale to help answer research questions?
Step 3: Hand out Tools of the trade – Exploratorium Stations Organizer (PDF) worksheet or record in lab journals. Student reminder: How do we measure in science? [Take a moment to remind students that when using calibrated tools, scientists measure to the last unit of certainty and estimate to the next decimal place. UNITS of what you measure (“grams of salt”) matter!]
Step 4: Working in groups, visit each of the 6 stations. Allow 5-10 min per station (stations vary in complexity). Encourage independent exploration, while circulating to help develop thinking (examples of teacher questioning strategies are in station preparation notes).
Step 5: Students with extra “downtime” may work on writing descriptions into their “Stations Organizer” worksheet or lab journal. Which of their investigation questions can they begin to answer? Do they need to collect more evidence?* (*If finished early or concurrently, students may begin preparing phytoplankton samples to use in Lab 3.5 Phytoplankton Spectrophotometry and Fluorescence for more in-depth, hands-on learning.)
Introduction: Students will read about Sally “Penny” Chisholm, who was the winner of the 2019 Crafoord science prize. Her Story of Discovery is interesting and is a great demonstration of tools and technology driving new discoveries. Once students learn about Penny’s work, they will apply this learning in pairs and then in an all-class discussion.
Step 1: Hand out (blank) version of Tools of the Trade – Story of Discovery (Google Doc | Word Doc). Students work in groups of two to read the story using the descriptions to help fill in the blanks with the name of the tool that she used for each new discovery in the story.
Step 2: As students read ask them to take notes, to build an understanding of how the various tools were “bundled” (used in combinations) over time and what they contributed to making the discoveries about Synechococcus* and the huge final Discovery of the very small Prochlorococcus(?) (*single-cell cyanobacteria).
Step 3: Conduct a student self-check for understanding by reviewing the story. Ask for students’ help to fill in the answers on the overhead (formative assessment).
Step 4: Discuss these questions with the whole class [pair-share first, from ideas they compiled on the back of their sheet]:
- What part of the scientific question did each tool help to answer? [Remember this happened over many years, and many expeditions.]
-
- What were the big questions “The Story of Discovery” investigations helped to answer?
Step 5: End with Video: Annenberg Learning —Unit 3: Oceans // Section 1: Introduction (show minutes 13- 15) (2 min) —an introduction to scientist Penny Chisholm in her lab talking about Prochlorococcus
Step 6: [PBL Option] Review learning (10 min) Use PBL reflections ‘Know /Need to know’ and the PBL summary table to help formulate ideas, before adding new components to their ‘Drop of Seawater’ art.
Final Step: Go on to Assessment Tab and then the optional Lab 3.5 Phytoplankton Spectrophotometry and Fluorescence
Assessments
How will I know they know……
- Observe the work students do in the application of this lesson– how well are they able to sort through the tools and apply tools with reasoning. Look at their notes in the Organizer:
- Does it matter where we take these measurements? Did students use a justification for where they want to take the samples (through Layers? Over time? Along a transect?)
- Have they shown that they are thinking about scale, and what is possible if we collect a lot of data from a lot of drops of ocean water?
- What question(s) will each tool help us answer and what data can we get using it? (ex. “Data collected from CTD could be useful for…” )
- Look at what students have added to the drop of seawater using the Drop of seawater Summary Table (Google Doc | Word Doc). How have they shown the relationships between the tools and how they can help scientists understand the systems found in seawater and oxygen production?
- Use student responses to Tools of the Trade: Story of Discovery the “Penny Chisholm story of discovery” (Google | Word). Are they understanding how scientists think about the data they are collecting? Are they demonstrating understanding of how similarities in different cells collected in the ocean can apply to wider populations — if so how?
- If you are doing Lesson 3.5, have the students complete the Lesson 3 pre/post assessment for the 2nd time (as their post) after 3.5. Or if you are stopping at this lesson, have them complete it as a post-assessment. Discuss the overall learning as a group.
Resources
- Pre/Post-assessment (Google Doc | Word Doc)
- Drop of seawater Summary Table (Google Doc | Word Doc)
- NOVA Video: Earth from Space (on PBS, on YouTube)
- Activity 1-3 Tools of the Trade — How will we monitor and protect the ocean? (Google Doc | Word Doc)
- Satellite images (Google Slides | PowerPoint)
- Explorer Question CARDS (Google Doc | Word Doc) and Explorer Questions – sorting organizer
- Teacher Resource – Tools of the trade: Exploratorium stations (ppt) (Google Slides | PowerPoint) and Tools of the Trade HOW TO SET UP (Google Doc | Word Doc); Teacher KEY for Tools of the Trade Organizer (Google Doc | Word Doc)
- Student Resource – Tools of the trade – Exploratorium Stations Organizer (Google Doc | Word Doc) (in PDF for easier printing)
- Teacher Resource – KEY – Tools of the trade: Exploratorium-Stations-Organizer (Google Doc | Word Doc); Lab 3.5: Phytoplankton Spectrophotometry and Fluorescence Lesson Plan (Google Doc | Word Doc)
- Student Resource – Tools of the Trade: Story of Discovery (Google Doc | Word Doc)
- Teacher Resource – Tools of the Trade: Story of Discovery (Key) (Google Doc | Word Doc)
- Annenberg Learning: Video Unit 3: Oceans // Section 1: Introduction (start at 13 min.)
- Virtual/Remote or Hybrid Teacher-Led Option:
- Teacher-Introduced with Student Completion in Partners:
- Teacher Resources: [Virtual] Tools Exploratorium Webquest Teacher Resource; Teacher KEY for [Virtual] Tools Explorer Organizer.
- Student Resources: [Virtual] Tools Exploratorium-Station-webquest – Student Version and [Virtual] Tools Explorer Organizer – Student Version
- OneNote Document used in Seattle Public Schools (this combines the above to Student Resource files)
Extensions
- The stations lead into more in depth studies in Lab 3.5: Fluorescing & Spec and Lesson 4 and 5, where this understanding is applied in activities using current ocean data.
- This activity was adapted from EARTH (Education and Research: Testing Hypotheses) – Microbial Ecological Roles BLAST activity Computer based (bandwidth limited if attempted with entire class)
- Design a bundle of tools to send down on a cast from an oceanography expedition, out of ALOHA. Good lead into HOT DOGS datasets in Lesson 5.
- Planktonplanet.org – series of images of collecting data, students would send samples, or download data from this site. Claims, listed – what evidence did they show?
- http://globecarboncycle.unh.edu/cmapTP.shtml# To show students how carbon is calculated (need permission to use one of the lessons in here about calculating carbon footprint/tree as carbon sink)
- Calculating oxygen content at depths: http://ocean.ices.dk/Tools/Calculator.aspx
Here are additional ideas for tools to learn about and discuss with students. What can be measured—that is outside of the tools already presented? How would they add to the story?
- Fe isotope measuring (amount of oxidized Fe in rock or shells?)
- Magnetism of earth’s crust (growth of earth’s crust over geologic time)
- Cell counts and culturing cells in controlled lab environment
- Photosynthesizers in lab environment – rate of oxygen production, then expand to the number of types of cells in sample area of ocean
Accommodations
Animations and videos: How tools work.
- http://www.divediscover.whoi.edu/tools/seanet.html
- http://www.divediscover.whoi.edu/tools/index.html
- http://www.divediscover.whoi.edu/tools/sonar.html
These short videos demonstrate different ocean physical characteristics that can be measured: http://www.divediscover.whoi.edu/circulation/demonstration.html.
You may need to provide a word bank for the Story of Discovery fill-in-the-blank activity. If so, the shuffled and alphabetized words from this answer key (Google Doc | Word Doc) are: BLAST sequences, CTD, flow cytometer, filtering, fluoresce, fluorescing red, microscope.
References
- Canfield, Donald E. “Oxygen: A Four Billion Year History,” Science Essentials, Dec 1, 2015
- Dutkiewicz, et al, Understanding Microbial Competition for Nitrogen, The Darwin project, MIT News (2018),
- http://www.ncbi.nlm.nih.gov/pmc/articles/PMC3263930/
- https://www.oceanfdn.org/calculator
- http://www.livescience.com/27551-our-amazing-planet-top-to-bottom-mountaintop-to-ocean-trench-infographic.html
- http://www.divediscover.whoi.edu/tools/index.html
- http://www.divediscover.whoi.edu/tools/seanet.html
- http://www.divediscover.whoi.edu/tools/sonar.html
- The Scale of the Microbial World, Marion Field Fass. Microbes Count!
- https://socratic.org/questions/how-do-you-calculate-molality-from-molarity
- https://www.aqua-calc.com/page/density-table/substance/seawater
- Oceanic observations of the Pacific 1950
- A.F. Post, The Prokaryotes: Vol. 4: Bacteria: Firmicutes, Cyanobacteria, pp. 1104, Chpt 2.3, (2006) Springer, edited by S. Falkow, E. Rosenberg, K.-H. Schleifer, E. Stackebrandt
- J. P. Zehr & Bess B. Ward, Nitrogen Cycling in the Ocean: New Perspectives on Processes and Paradigms (2002) DOI: 10.1128/AEM.68.3.1015-1024.2002
- S. Rabouille, et al, Modelling the vertical distribution of Prochlorococcus and Synechococcus in the North Pacific Subtropical Ocean, Microbrial Ecology, 17 July 2007; https://doi.org/10.1111/j.1462-2920.2007.01376.x
- Rex R Malmstrom, […] S. Chisholm, et al. Temporal dynamics of Prochlorococcus ecotypes in the Atlantic and Pacific oceans, The ISME Journal, vol. 4, pgs. 1252–1264, (May 2010)
- Mikhail V. Zubkov, et al, High Rate of Uptake of Organic Nitrogen Compounds by Prochlorococcus Cyanobacteria as a Key to Their Dominance in Oligotrophic Oceanic Waters, Microbial Ecology, Feb 2003, 69 (2) 1299-1304; DOI: 10.1128/AEM.69.2.1299-1304.2003
Ways of seeing Experimentation:
- http://serc.carleton.edu/eet/phytoplankton/index.html
- http://serc.carleton.edu/eslabs/fisheries/7.html
- SeaWiFS Biosphere globes. User enters lat / long, season and SeaWiFS plankton image comes up on global projection. http://oceancolor.gsfc.nasa.gov/cgi/biosphere_globes.pl
- NASA Goddard Space Flight Center, Ocean Ecology Laboratory, Ocean Biology Processing Group; (2014): Sea-viewing Wide Field-of-view Sensor (SeaWiFS) Ocean Color Data, NASA OB.DAAC. https://oceancolor.gsfc.nasa.gov/
- International Ocean Colour Coordinating Group http://www.ioccg.org
- C-More bead activity on random sampling to est. species numbers http://stempreacademy.hawaii.edu/c-more/random-sampling/
- Ward, Peter D., “Out of Thin Air — Dinosaurs, Birds, and Earth’s ancient atmosphere” Joseph Henry Press, Sep 26, 2006
- Reference for ocean satellite images – https://disc.sci.gsfc.nasa.gov
- Limnology background information used in the exploratorium stations:
- http://science.sciencemag.org/content/304/5669/408.full
- http://www.nature.com/nature/journal/v407/n6805/fig_tab/407685a0_F1.html
- http://seaglider.washington.edu/story/Deepglider.html
- The Global Ocean Observing Systems – Observations and Data ( https://www.goosocean.org/index.php?option=com_content&view=article&layout=edit&id=308&Itemid=271)