Curriculum Modules

Observing Beyond our Senses: Inquiry Drives Technology
Unit & Lesson Plans Flow Chart Printable Overview Contributors
What happens when a scientist has a question that cannot be answered using current technologies?
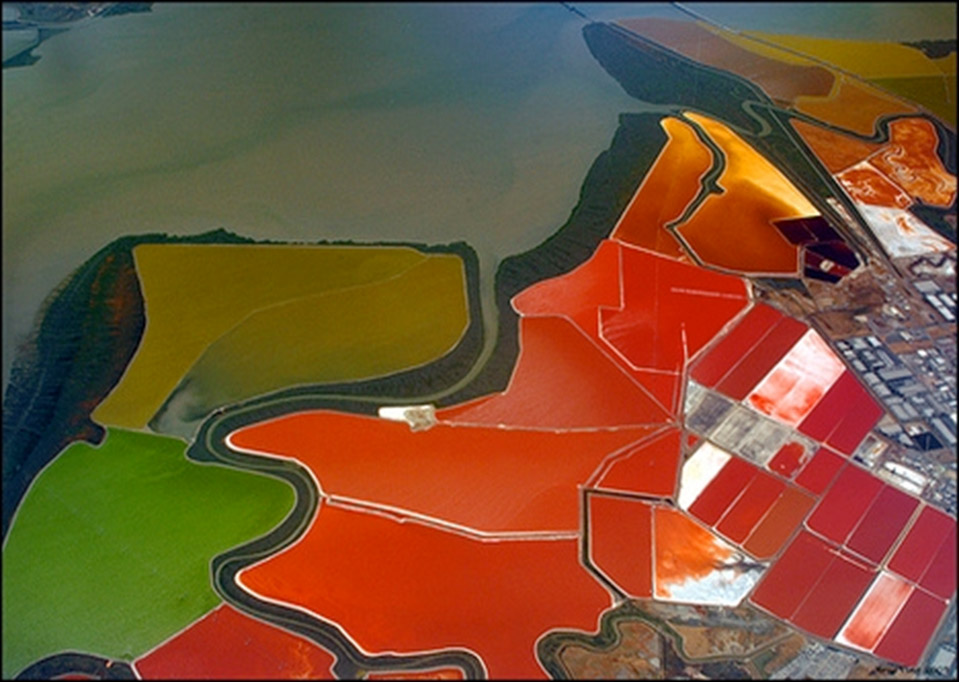
Salt plain (lesson 1 powerpoint)
In this module, students focus on the role of physics and engineering in the increasingly interdisciplinary field of systems biology. Centered on a case study requiring instrumentation for field research, the driving question is “How do scientists measure what they cannot directly observe with their senses?” The complexities of proxy variables, the limitations of inferences, and the interpretation of quantitative data are examined. Tradeoffs in instrumentation design related to precision, accuracy, resolution, sampling rate, sample size, signal amplification, signal and noise, and calibration are explored. This series of inquiry based activities utilizes the graphing visualization capabilities of excel and student built instruments. Extension activities may make use of real time data collection probeware such as Vernier or Pasco. The culminating project for the unit is a case study where students develop a water management plan for a high saline environment impacted by mine tailings.
After an introduction to high salinity environments and the halophilic microbes found there, students’ existing understanding of instrumentation is probed through initial ideas for measuring microbial populations invisible to the naked eye. This suggests the need for instruments and methods to accurately observe what is not easily observable. A formal process to develop an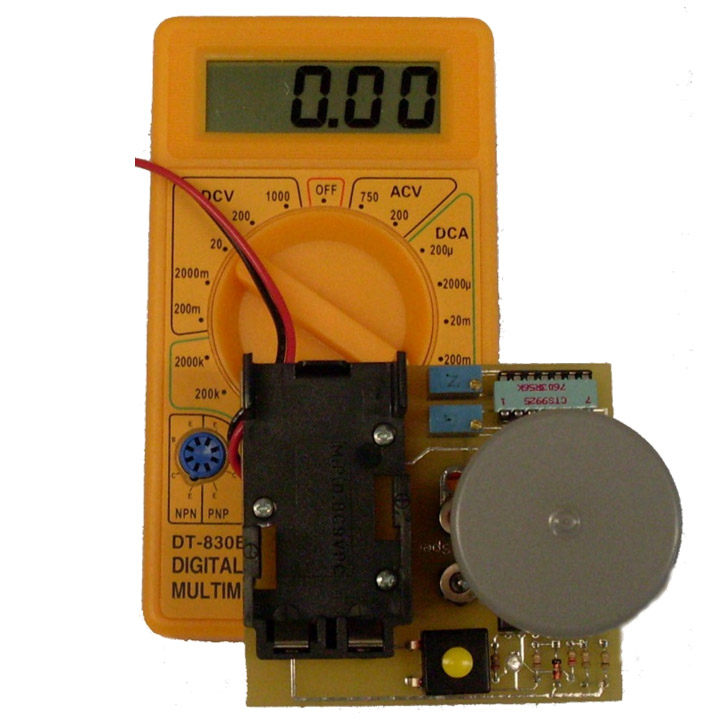 d evaluate potential solutions to a design problem is introduced through an initial design challenge–develop a method to measure wind speed. The importance of the application to define criteria related to precision and sampling rate for a measuring device is emphasized. Inferences from proxy variables and issues of resolution and pattern prediction are explored with a mock Atomic Force Microscope. After analyzing 3D plots in excel, students evaluate the trade-offs of increased resolution of the “touch” data recorded by their mock Atomic Force Microscope. Signals and noise are explore through the use of semaphore (hand signals). An option for more advanced students is a student-assembled op amp circuit using an ipod, breadboard components, and a small speaker introduces students to electrical signals as proxy variables. The trade-offs in amplifying electrical signals are evaluated through signal and noise estimates utilizing mp3 files and real time data collection with voltage probes. Next, amplified electrical signals are combined with the characteristic scattering and absorption behavior of light to build conceptual understanding of a spectrophotometer. Students build a simple photometer and generate standard (calibration) curves to introduce quantitative inferences from proxy variables. Students then use these standard curves to identify an unknown concentration of milk fat globules.
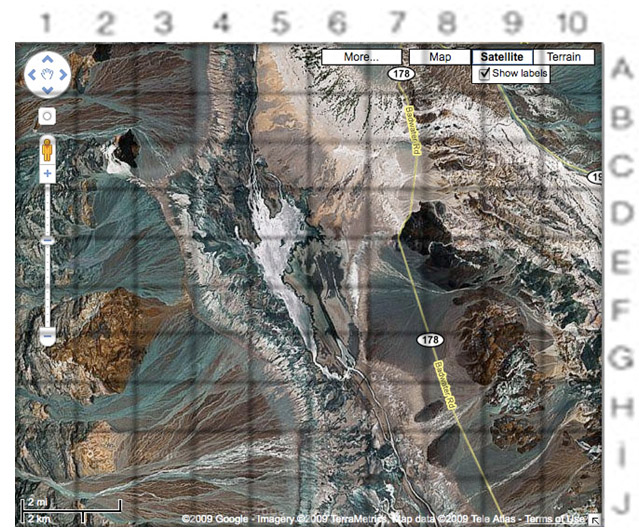
Death Valley Middle Basin map grid (Lesson 6)
For the culminating project, student groups are provided gridded maps and background information on Middle Basin in Death Valley. Students generate an initial sampling plan based on limited resources that mimics constraints scientists address when in the field. Students make inferences on locations of point source pollution and freshwater sources by mapping population densities of two indicator species of halophilic microbes. Students use their photometers to determine the population densities which are simulated with milk fat or grapefruit juice concentrations. Student groups pool their initial sampling data and evaluate trends based on their knowledge of the precision of the photometer from their own calibration curves before detailing a 2nd round of focused sampling in areas gridded at a higher resolution. Their findings and recommendations are presented in a water management plan.
Target Audience
The target audience for this kit would be students in STEM and related classes such as biotechnology, integrated science, and also physical science courses such as physics and chemistry. Exposure to precision and accuracy in measuring and analysis of trends in quantitative data would strengthen learning this module. Access to computers and some familiarity with Excel is a key component of this module. Access to computers for real time data collection using systems such as Vernier or Pasco is useful for extension activities.
License
![]() Except where otherwise noted, the Observing Beyond Our Senses: Inquiry Drives Technology module, copyright Institute for Systems Biology (ISB) through Baliga Systems Education Experiences, is available under a Creative Commons Attribution-NonCommercial 4.0 International License. All logos, trademarks, and videos are property of their respective owners. This resource may contain links to websites operated by third parties. These links are provided for your convenience only and do not constitute or imply any endorsement or monitoring by ISB or ISB’s funding agencies. Please confirm the license status of any third-party resources and understand their terms of use before reusing them.
Except where otherwise noted, the Observing Beyond Our Senses: Inquiry Drives Technology module, copyright Institute for Systems Biology (ISB) through Baliga Systems Education Experiences, is available under a Creative Commons Attribution-NonCommercial 4.0 International License. All logos, trademarks, and videos are property of their respective owners. This resource may contain links to websites operated by third parties. These links are provided for your convenience only and do not constitute or imply any endorsement or monitoring by ISB or ISB’s funding agencies. Please confirm the license status of any third-party resources and understand their terms of use before reusing them.