Invisible Forest: What’s in a Drop of Seawater?
Unit Plan
Course: Marine Science, Oceanography, Integrated Science, STEM. These lessons may also fit within these courses: Biology, Honors Biology, Chemistry, Earth Science, Life Science, Physical Science, Physics, AP Chemistry, AP Physics, AP Biology, AP Environmental Science.
Unit: Photosynthesis, Ecology, Biogeochemical Cycling, Energy, Photosynthesis, Phytoplankton, STEM application, skills building, engineering design
This 4-week set of lessons is based on the oceanographic research of Dr. Anne Thompson of Portland State University in Oregon, which focuses on the abundant ocean phytoplankton Prochlorococcus. These interdisciplinary STEAM lessons were inspired by Dr. Thompson’s lab and fieldwork as well as many beautiful visualizations of Prochlorococcus, the ocean, and Earth. Students learn about the impact and importance of Prochlorococcus as the smallest and most abundant photosynthetic organism on our planet. Through the lessons, students act as both scientists and artists as they explore where breathable oxygen comes from and consider how to communicate the importance of tiny cells to human survival.
This module is written as a phenomenon-based, Next Generation Science Standards (NGSS) three-dimensional learning unit. Each of the lessons below also has an integrated, optional Project-Based Learning component that guides students as they complete the PBL process. Students learn to model a system and also design and evaluate questions to investigate phenomena. Students ultimately learn what is in a drop of ocean water and showcase how their drop contributes to our health and the stability and dynamics of global systems.
Objectives
What Students Learn
- What is in a drop of seawater and how that drop is part of the Earth system.
- To design questions to gain new information through the Project Based Learning process. They evaluate and revise their questions based on new information that is presented. In the end, they learn what microbes are in a drop of seawater and how these cells contribute to the oxygen in the atmosphere. They specifically focus on phytoplankton as the source of that oxygen.
- Throughout Earth’s history levels of oceanic and atmospheric O2 varied dramatically.
- Current O2 levels can be measured directly in air.
- To measure the O2 produced in a non-living system and apply to a living system.
- O2 in the air is produced by phytoplankton and land plants.
- Living organisms produce O2 within a single drop of water.
- A big picture view is necessary when studying real-world complexity, as is the ability to analyze subnetworks within a system.
- There are many different types of photosynthesizers.
- Photosynthetic organisms, being able to capture light energy and transform it into chemical energy are recognizable by examining their internal structures and function.
- Prochlorococcus is the world’s smallest and most numerous oxygenic photosynthesizer. What’s the scale, anatomy, organelle function, and life of Prochlorococcus at nano-scale?
- Phytoplankton share common structures/metabolism with other photosynthesizers.
- How Prochlorococcus was discovered and its role in oceanic / global productivity.
- How measurements are collected at the scale of both surface and deep ocean
- Technical tools are available to collect data from the simple cultured in the lab-scale to the larger global scale
- Data can be used to compare environmental conditions that influence homeostasis in ocean phytoplankton and other populations
- Different types of phytoplankton have different patterns of distribution across the globe, due to abiotic and biotic differences
- There are multiple ways to collect data on phytoplankton distributions and diversity on global scales, which may lead to different “answers” on the details of their distributions.
- How to collect data from different types of figures and present the data in a new way
- How to combine two important tools – DNA analysis and flow cytometry to determine how many of which phytoplankton groups are present
- How to interpret chlorophyll data gathered from a satellite and identify its advantages and disadvantages
- Ecosystem models can be used to test what we know about a system
- Ecosystem models help scientists expand small-scale observations to study global processes
- For the optional stand-alone or extension Lesson 5, students learn
-
- the sources of oxygen on Earth
- the basic physical & chemical oceanography concepts
- the physical and chemical environment of phytoplankton
- how physical and chemical ocean properties change over depth and time
- how atmospheric and oceanic research sites are located
- where data is available about the open ocean (and what data HOT-DOGS provides)
- what a data dictionary entails
- how to perform data extraction from a data portal
- how to perform data conditioning and analysis in Excel™/ LoggerPro™
- how to create plots using web-based oceanographic data in Ocean Data View (ODV)
- how to communicate findings
-
What Students Do
- Design questions to guide their curiosity as they move through each lesson of the module.
- Watch a clip from the movie, Water World and discuss what the world might be like if there were no land plants. They focus on the question: Where does our oxygen come from?
- Complete a pre-assessment and several formative assessments on what is in a drop of seawater. At the end of each lesson students will add to an ongoing unit summary – What’s in ‘A Drop of Seawater?’.
- Re-examine initial understanding of what is in a drop of seawater at the end of each lesson, incorporating new information gathered in that lesson.
- At the end of the PBL/module, students reflect on what they learned in the module by building an artistic piece that focuses on the guiding question, “How do we make the invisible forest visible to others? And, why might that be important?”.
- Develop and apply the skills of collaboration.
- Interpret and analyze the data from geological history of O2.
- Observe and collect data from one or more lab activities and demonstrations.
- Calculate and graph results from one or more lab activities and/or demonstrations.
- Watch a short video to learn about plankton as a source of O2.
- Card sort of 26 autotrophs and heterotrophs to stimulate student thinking on the identification of photosynthesizing organisms.
- Observe fresh or seawater phytoplankton with a microscope.
- Learn Prochlorococcus cell structure and functions. Relate scale of the cell to light waves, virus, and eukaryotic chloroplast.
- (optional) Review photosynthesis by working through a ‘webquest’ (1 x 50 min)
- View video + teacher-led discussion on Prochlorococcus place in oceanic / global productivity.
- Explore and define the different tools for measuring and collecting evidence about ocean microorganisms, and the ocean ecosystem (small and large scales)
- Use models of BLAST bioinformatics and flow cytometry to explore ocean phytoplankton diversity
- Watch a video of a model of phytoplankton distributions across the globe (Darwin Model) in order to answer questions and engage in discussion to capture students’ initial level of understanding of how phytoplankton distributions and diversity can be determined across the globe
- Use data to ask how phytoplankton populations change across the Atlantic Ocean
- Work in small groups to collect information from three different sets of data and plot the data on a new graph
- As a class, compare graphs and discuss any differences
Revisit the Darwin Model video and discussion questions to evaluate types of evidence and how they can be used to predict changes in ecosystems over time - For the optional stand-alone or extension Lesson 5, students
-
- take the Invisible Forest pre and post assessment (if doing this lesson as a standalone)
- participate in group discussion
- watch short oceanography videos in order to list claims made, and evidence supplied
- create a data dictionary
- are introduced to the HOT-DOGS – ALOHA site
- generate testable questions related to the data available
- download and condition data in Excel™/ LoggerPro™ for spatial and temporal analysis
- create plots using eWOCE gallery and web-based oceanographic data conditioned for Ocean Data View software (ODV)
- communicate findings including questions for further research.
-
Pacing Guide
| Our Invisible Forest: What’s in a Drop of Seawater? | ||
| Name of Lesson | Main Question(s) Explored | # of 50 min. Class Periods |
| 0. PBL Introduction | In a world without land, would we always have enough oxygen? What is in a drop of seawater that supports life on the planet Earth?
How do we make “the Invisible Forest” visible to others? How can students design their own questions that drive the study of a phenomenon? |
1-2 |
| 1. A Breath of Oxygen | Where do living systems acquire their breathable oxygen? What is the geological history of oxygen on planet Earth? How could we measure the production of oxygen on the planet? Which organisms produce oxygen on our planet today? | 2-3 |
| 2. Who’s Who in the Photosynthetic World from the macro to nano-scale | How do we know which organisms photosynthesize? How small can living things be that still carry out all the functions of life? | 2-3 |
| 3. Tools of the Trade Exploratorium | How can we collect oceanographic data from where we cannot be or see in our vast ocean? How do we know what we know? | 2 |
| 3.5 Phytoplankton Spectrometry and Microscopy Labs 1&2 – Phytoplankton Chlorophyll Absorption and Fluorescence | How do living systems convert light energy into chemical energy, and generate oxygen? What instruments are used to study phytoplankton and chlorophyll on a global scale? | 4-6 |
| 4. Scaling Up: Linking cells in a Drop to Global Ocean Patterns | Why do different types of photosynthesizers have different distributions? What are the limitations and strengths of different methods for understanding global ocean patterns, diversity and dynamics? | 2 |
| 5. Dive into Data: Raw to Results* | How can we accurately and effectively represent data trends and patterns? (*for Advanced classes). | 1-4 |
| Final Art Project, Applications and Summative Assessment (also located within lesson plans and at the end of Lesson 4 and 5) | How do we make this invisible forest visible to others? Why is sharing the invisible forest important? | 2 |
| Click here to view the NGSS STANDARDS for all lessons. Also, within each lesson page is a list of NGSS covered within each lesson. | ||
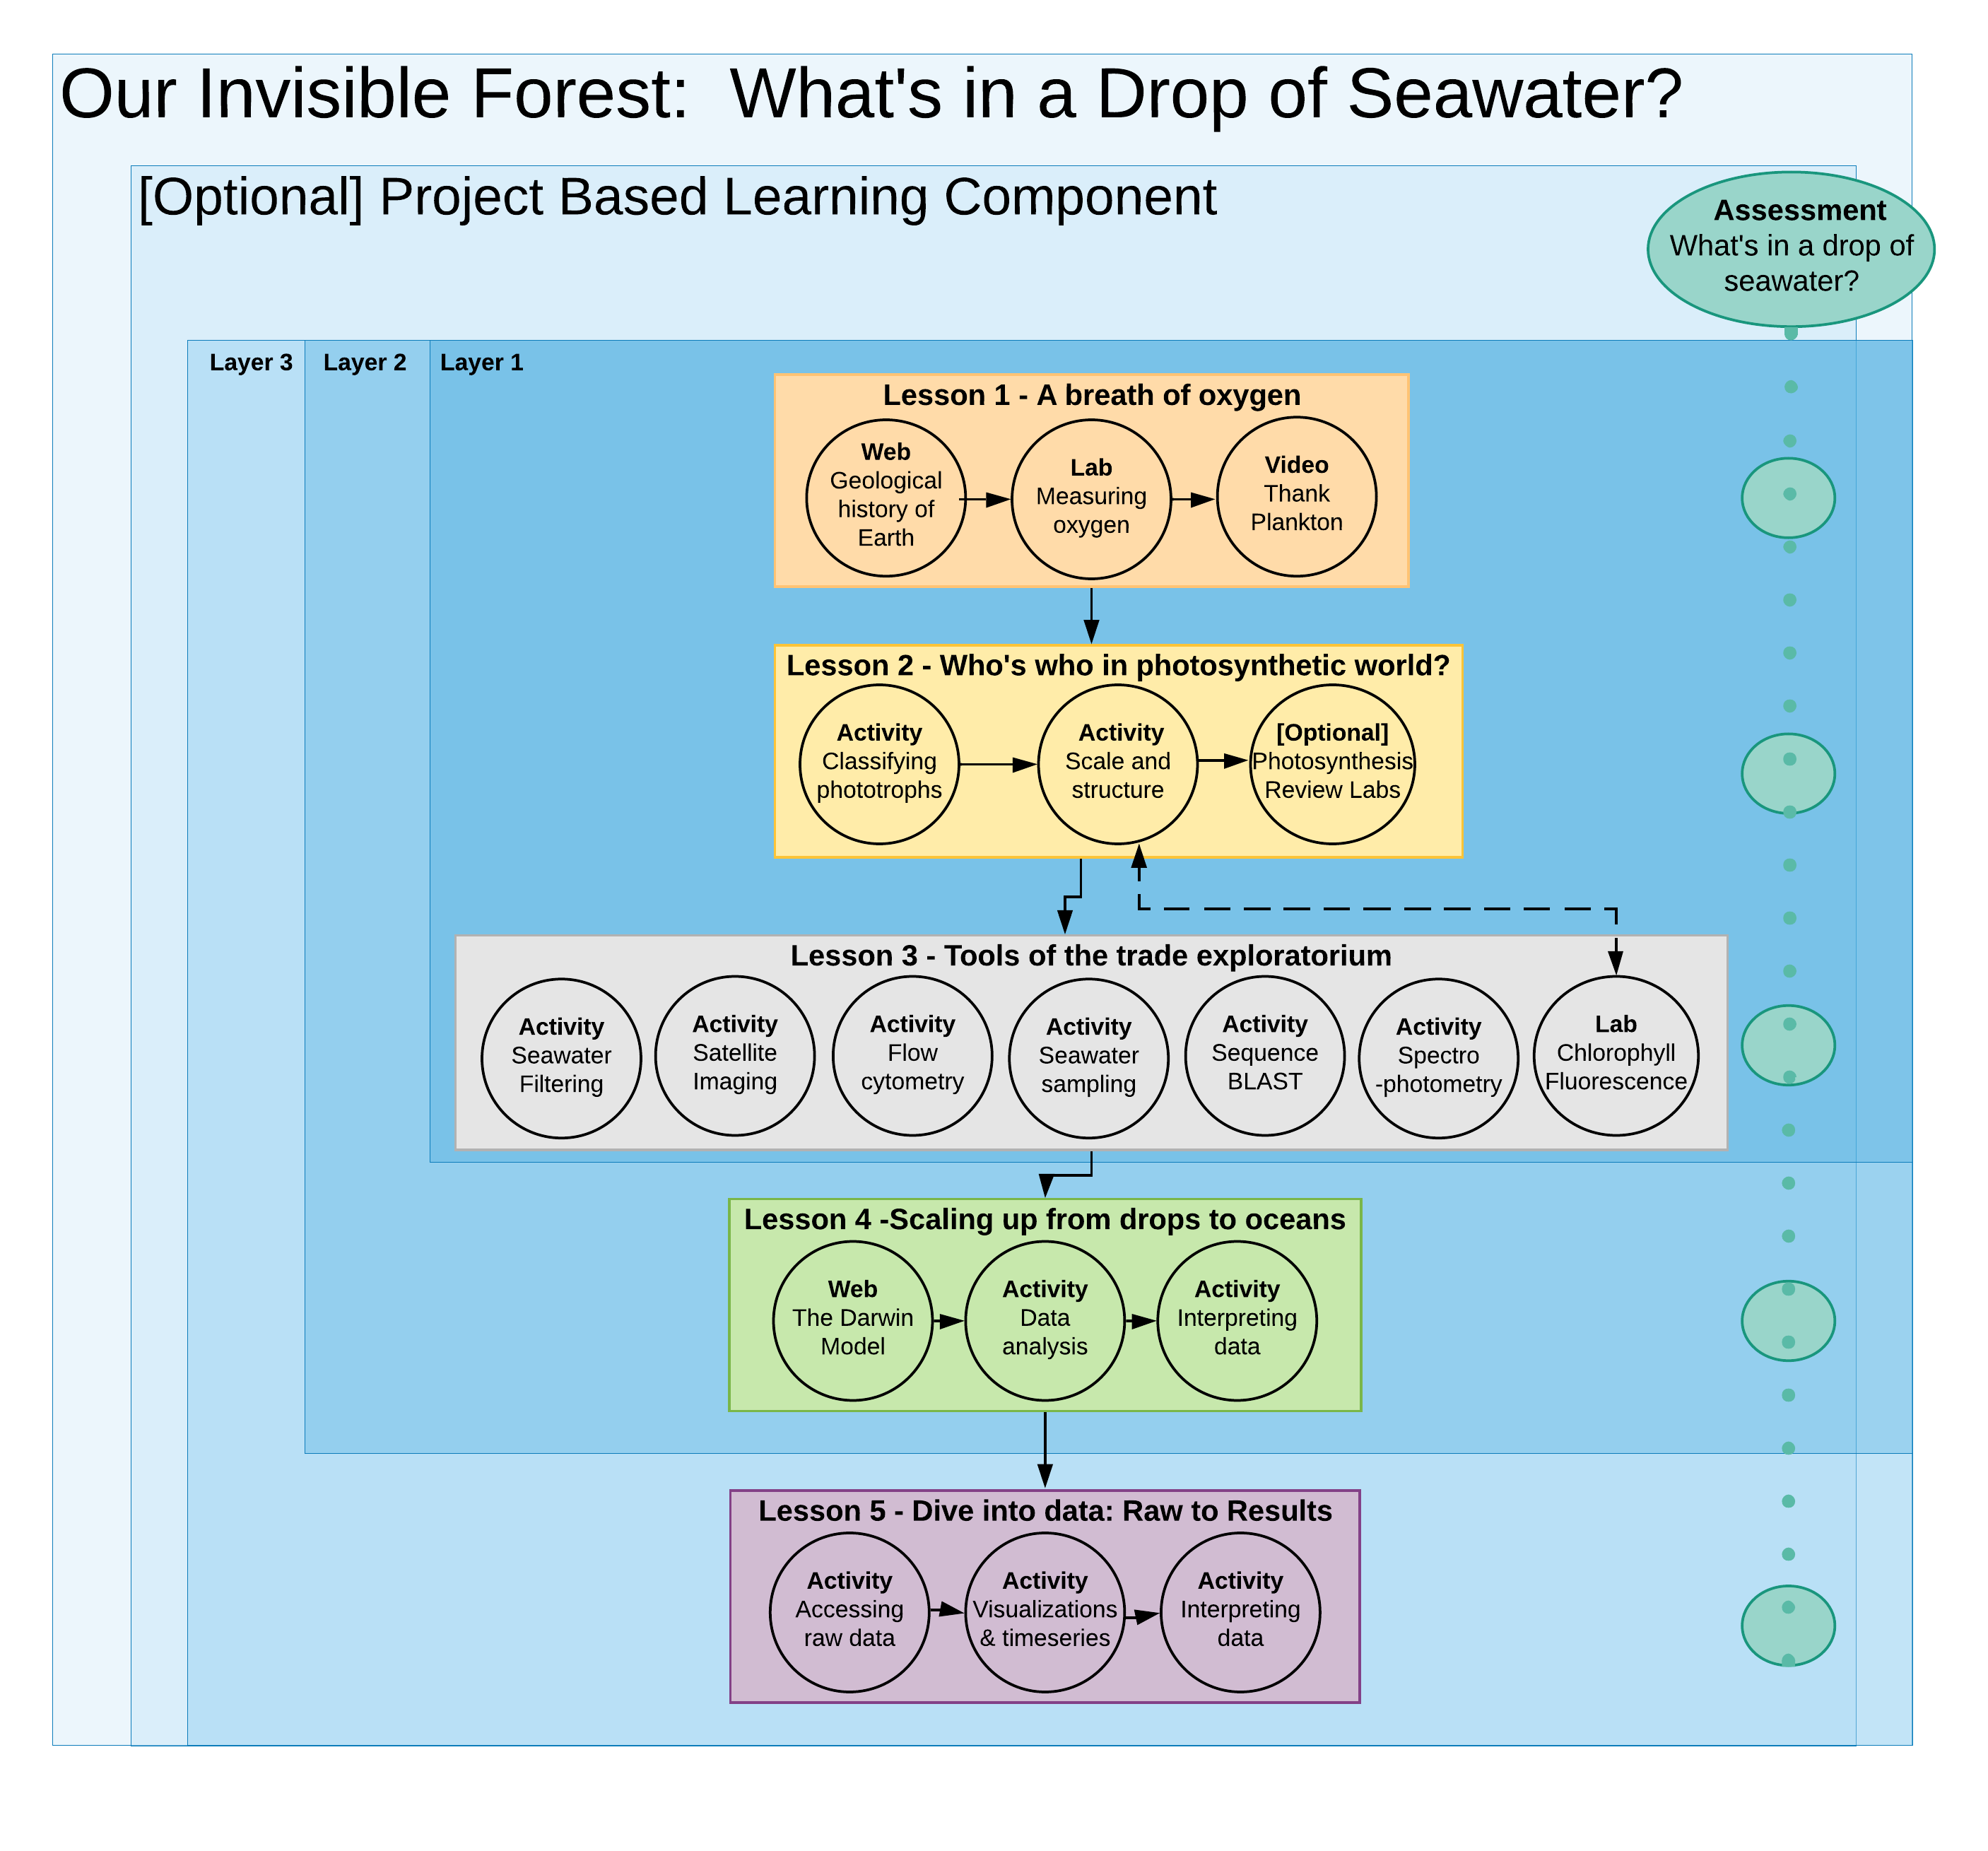
Lesson Description
Read the lesson outline above and below with the above Lesson sequence overview figure. This figure is organized into layers, via shades of blue, to demonstrate which lessons and activities are easily grouped together. If using Project-Based Learning (PBL) the 0.5 Lesson is one that should be used at the beginning of the module and then at the beginning and end of each lesson. Layer 1, Lessons 1-3 are suitable for all high school students. Layer 2, Lesson 4 is a data-focused lesson that is suitable for most high school students, but perhaps not all. Layer 3, Lesson 5 is recommended for 11th-12th grade students and excel-savvy teachers who want to take data from a “raw” state in order to create advanced graphics. That lesson can be completed as a stand-alone. Please see the descriptions below for more information.)
Lesson 0 Plan – Project-Based Learning (PBL)— What is in a drop of seawater that supports life on the planet Earth? How do we make “the Invisible Forest” visible to others? Introduce the phenomenon that leads to question formation. As students begin to ask their own questions and try to answer them, they will gain critical thinking skills and explore various environmental phenomena about the Invisible Forest. PBL is woven into the lessons, by design, to encourage students to express learning through Art.
Lesson 1 Plan – A Breath of Oxygen— In this activity and lab experience students discover where oxygen comes from and how it can be measured. Learn about the methods used to measure oxygen production through photosynthesis to understand how to apply this at a global scale.
Lesson 2 Plan – Who’s Who in the Photosynthetic World?—introduces phytoplankton. How do we know which organisms photosynthesize? What is in a drop of seawater? Identify photosynthesizers and review what it takes to be able to use light as an energy source while producing oxygen as a globally useful waste product.
Lesson 3 Plan (New Virtual Lesson Now Available!) – Tools of the Trade Exploratorium—measuring and collecting Oceanographic data from where we cannot Be or See requires technological tools. Take a tour to explore how we collect and interpret data from the Invisible Forest.
Lesson 3.5 Plan for Labs 1 & 2– Lab 1. Photosynthesizers of the Invisible Forest—microscopes give an “A Ha!” moment when students see the phytoplankton in action before their own eyes in fresh or ocean water. Lab 2. Phytoplankton Absorption and Fluorescence – this investigation uses spectrophotometry to explore the transformation of carbon into energy and oxygen for other living things. and builds understanding of what happens when phytoplankton chlorophyll interacts with light.
Lesson 4 Plan – Scaling Up: Linking Cells in a Drop to Global Ocean Patterns—is a guided practice using publicly available data from an oceanographic research cruise. Students interpret three types of ocean data to address a common single question about the distribution of different types of phytoplankton. Develops an understanding of how different data types can address and give different answers to the same question. Prepares students to design an ocean investigation of their own.
Lesson 5 Plan (Draft and only for Advanced Classes) – Dive into Data: Raw to Results— Use data to understand the Nature of Science and oceanography in an advanced* lesson. Uses ocean data from publicly funded projects near Hawaii. Students learn to access, process, and get the first crack at the most recent ocean research. Through this students gain computer modeling skills using free downloadable Excel, Vernier Logger Pro and Ocean Data Viewer software.
Background/Prerequisites: (Please note – these prerequisites can actually be taught concurrently. Lessons include ideas on how to interweave concepts with the standard curriculum while applying learning.)
-
-
- Hydrosphere, atmosphere and biosphere are interconnected through Earth cycles (carbon, water, and nitrogen cycles).
-
- Temperature, light and nutrients are dynamic in the ocean and influence what phytoplankton will survive.
-
- Photosynthesis (bio-molecules are rearranged, light energy is transformed into chemicals used by organisms as an energy source).
-
- Ocean food webs (exchange of energy)
- Carbon, oxygen and energy are exchanged in the ocean, just like on land (TIP: demonstrate using Elodea photosynthesis-respiration experiment)
-
- Cell structures (chlorophyll, proteins, cell membrane, cell walls)
- Basic chemistry concepts of atomic structure and redox/combustion
-
Resources
All documents and files for each Lesson are found within the lesson links listed above. You can complete the bulk of these lessons without any special equipment. If you want to add hands-on lab experiments, you can also use inexpensive equipment and/or can culture your own algae from the natural environment.
Assessment
All formative and summative assessments are embedded within each lesson plan and are contained within a google drive folder. Because this module has content that can be covered across many years of the K-12 system and because of the optional Project Based Learning pedagogy of this module, the assessments teachers choose to use may vary according to student level and context. Please feel free to reach out to our team at see@isbscience.org for help deciding which options may be best for your course.
License:
![]() Except where otherwise noted, the Our Invisible Forest: What’s in a Drop of Seawater? module, copyright Institute for Systems Biology (ISB) through Baliga Systems Education Experiences, is available under a Creative Commons Attribution-NonCommercial 4.0 International License. All logos, trademarks, and videos are property of their respective owners. This resource may contain links to websites operated by third parties. These links are provided for your convenience only and do not constitute or imply any endorsement or monitoring by ISB or ISB’s funding agencies. Please confirm the license status of any third-party resources and understand their terms of use before reusing them.
Except where otherwise noted, the Our Invisible Forest: What’s in a Drop of Seawater? module, copyright Institute for Systems Biology (ISB) through Baliga Systems Education Experiences, is available under a Creative Commons Attribution-NonCommercial 4.0 International License. All logos, trademarks, and videos are property of their respective owners. This resource may contain links to websites operated by third parties. These links are provided for your convenience only and do not constitute or imply any endorsement or monitoring by ISB or ISB’s funding agencies. Please confirm the license status of any third-party resources and understand their terms of use before reusing them.