Lesson 4 – Planning Cohesive Experiments
 Description: When teaching the topics of ocean acidification, climate change, ecosystems, and sustainability, helping students model the collaborative nature of science is an important endeavor. When tackling “big problems” scientists from different disciplines directly communicate and divvy up research into projects that best use available resources and lead to more comprehensive understanding. The goal of this lesson is to guide student groups as they plan their experiment and ultimately develop a class-wide, cohesive set of experiments that work together to answer the big question and their group’s individual sub-question.
Objectives
Course: Life Science, Integrated Science, STEM, BioChem, Marine Science
Unit: Ocean Acidification, Ecology, Biogeochemical Cycling
See Standards Addressed for all NGSS, WA State (Science, Math and Literacy), and NOAA Ocean Literacy Education Standards Connections. In addition to the aligned objectives linked above, for this lesson, here is a breakdown of:
What Students Learn
- Systems scientists work together (collaborate) to build off of each other’s experiments to achieve enough data and experimental evidence to understand complex relationships.
- Preparing and planning for experimentation is required for successful implementation of research.
- Experimental ideas often come from the needs and passions of humans.
- Systems thinking is a useful technique for understanding complex situations.
- Systems thinkers use systems diagrams as tools of their trade.
- There are many types of systems; these can be represented in many ways and have many different properties and forms, such as being in equilibrium, containing balancing loops, reinforcing loops, etc.
What Students Do
- Students collaborate to design experiments.
- Students refine and narrow a question based on a large, big picture question.
- Students build their hypotheses, make predictions, design how they will measure outcomes, list needed equipment/materials, and complete procedural flow charts and protocols.
Instructions
Introduction: When teaching the topics of ocean acidification, climate change, ecosystems, and sustainability, helping students model the collaborative nature of science is an important endeavor. When tackling “big problems” scientists from different disciplines directly communicate and divvy up research into projects that best use available resources and lead to more comprehensive understanding. The goal of this lesson is to guide student groups as they plan their experiment and ultimately develop a class-wide, cohesive set of experiments that work together to answer the big question and their group’s individual sub-question.
Pacing Guide for this Lesson: 1 to 2, 50 minute class periods.
Advanced Prep
- Review the examples of different experimental possibilities in the Teacher Guide to Experiments document (Google Doc | Word Doc), the photo of a teacher’s whiteboard list demonstrating the many different experimental options, the Teacher’s Guide for Tracking Student Experiments document (Google Doc | Word Doc), and the list of commonly used materials (Google Doc | Word Doc) in order to familiarize yourself with the many possible experimental ideas that will emerge during this lesson. Also, many teachers find it is helpful to gather a variety of equipment and materials on a lab bench for students to look at and consider while they are brainstorming with their lab group.
- Prior to this lesson, make sure your students understand:
- that ocean acidification is a situation that requires a systems study (since it has many parts with interactions, emergent properties, reverberating effects, etc.)
- that this situation has a large, global human and economic component – it affects us all, yet there are very different stakeholders
- basic properties of CO2
- the importance of taking careful notes and keeping a lab book
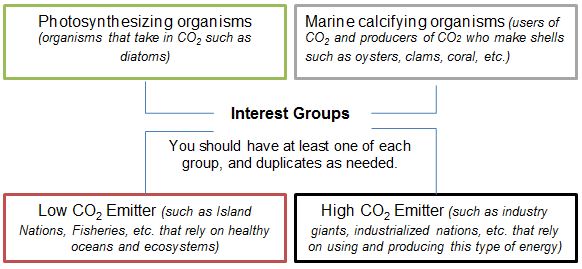
- Set up each class’s interest groups – Tally the student requests you received at the end of Lesson 3 to decide on appropriate lab interest groups. We recommend you have 2-4 students in each group. All experiments will collaboratively work together to give insight into ocean acidification and will model real science. Here is a schematic that breaks down the different possible interest groups:
Lesson Sequence and Specific Instructions
1. Have students take their lab notebooks out and load the “Planning Cohesive Experiments” PowerPoint Presentation (Google Slides | PowerPoint). Hand out, or list, the previously assigned student interest groups while students answer the warm-up questions in their notebooks. These warm-up questions are listed on Slide 2. (Warm-up questions = 1. How is OA a global problem? 2. Is OA a situation that requires a systems study? Why or why not? 3. What do you think systems thinking is?)
2. Remind students of previous work (if needed) and the goal of today’s class (see objectives). This can be quickly achieved by briefly explaining the flow of these lessons and introducing the final summit. Briefly introducing the final summit will help students see where their learning is going and understand why they need to listen and understand today’s lesson. In the summit, student groups will present their experimental results and provide recommendations in a manner similar to those in other global summits (explained further in upcoming lessons). Encourage students to make their end product (research results, summit presentation) an easy next step by taking careful notes, pictures, and diagrams throughout today’s lesson as well as during the final lessons in this module.
3. Present the remaining slides in the presentation. Slides 3-9 of the presentation provide a review of systems and Lesson 3’s work to consider this with a systems approach.
- Slides 3-4: Use these slides to lead a discussion that emphasizes “thinking” as a process that occurs through logical thoughts, ideas, and possibilities. If students have a difficult time articulating “thinking” ask them to give examples of “not thinking” and work backwards.
- Defining “Systems” is much more difficult. This is an area where your non-science enthusiasts should especially weigh in with their point of view. If you have the book, “Uncovering Student Ideas in Science, Vol. 4” by Page Keeley, page 81 contains a great assessment probe that leads to a terrific discussion. This is the probe used in Slide 4. You can print Dr. Keeley’s worksheet, or print slide 4 and have students complete it independently. Next, have a class discussion on possible explanations. As an answer, Dr. Keeley argues that, “The best answer is that everything except for the pile of sand and box of nails can be considered a system. If you remove some of the sand, it is still a pile of sand….The nails in the box do not interact with or influence each other….However there are ways one could stretch this to justify that the sand pile or box of nails is a system. For example, the atoms that make up the sand or nails interact with one another.” Students also like to talk about gravity being a node in a system which would certainly have implications to anything in a pile. At this point, there may not be any “right” answers, which is helpful when discussing the process of thinking.
Project 2061 also has a great list of “Questions to Ask About Systems” that would be very useful to instill better systems thinking. See also these pages for more information: http://www.project2061.org/publications/sfaa/online/chap11.hrm, http://www.project2061.org/publications/bsl/online/index.php?chapter=11. - Slide 5: This lists the Waters Foundation poster of the thirteen habits of a systems thinker. At the end of this module we’ll come back to these habits and have students evaluate whether this unit helped them build these skills and fostered the development of these good habits. Introduce this slide at this time to give context for practical uses of systems thinking. Systems thinking is a process that doesn’t always come naturally, but can be useful in many areas. Developing the habits of a systems thinker help us tackle big, sometimes ambiguous problems. Have students give examples of when these habits might come in handy (during typical high school dramatic relationships, when studying complex scientific phenomena such as ocean acidification, and many more).
- Slides 6-7: Like any trade, there are tools for systems thinkers to use that help them achieve their tasks of thinking holistically, exploring complexity, and sharpening awareness of how the parts of the whole interrelate and result in emergent properties. See the Waters Foundation website (http://www.watersfoundation.org) for more information and examples.
- Slide 8: This slide begins to incorporate general systems diagrams into the pertinent content on the carbon cycle. The balancing versus reinforcing loops were first seen in slide 6. Have them break those words down to guess what each means and what this slide shows. (Reinforcing, because the hysteria is not balanced by anything and just increases and increases with nothing to stop the hysteria. The “+” on each arrow indicates the “spiraling out of control” nature of this reinforcing loop.) Remind students of Lesson 3’s group activity of drawing CO2‘s loops. In response to the powerpoint question of, “What about the CO2 loop in our environment?” they should be able to remember that the situation was once somewhat balanced, but now evidence suggests it is not. Research and experimentation can tell us more about what is currently happening with this cycle.
- Slide 9: This is a duplicate of what was completed in Lesson 3 on the board. It is good to show this again, in this form, to emphasize the importance of understanding that for many years this situation was balanced. However, now with increasing combustion reactions, we must ask the questions: What is the counterpart to all of that CO2? The ocean? Is that a good thing or a bad thing? Do we have all the answers? (no) Can we study this in our class with our resources? (yes!)
- Slides 10-12: Build off of this last question to begin exploring how studying this in your class will work.
4. While slide 10 (Working together to understand CO2, ocean acidification and its implications) is open, have students write down the main question in their notebook: What effect does the increasing atmospheric CO2 have on the ocean and its subsystems?
5. Lead a discussion first as a class that allows students to brainstorm how they can contribute by experimenting in your lab to this research question. You can also use a Think-Pair-Share here as an option. Questions to get them talking and thinking:
–What could you measure in the lab, what outcome will you be hoping to observe or measure, what have you measured in previous labs, how will you know what you know? (Possible student answers: pH, amount of CO2, source of CO2, nutrient levels, rate of shell dissolution, mass, temperature, salinity, population count, optical density with spectrophotometers or fluorometer)
– What evidence could help you advocate for your interest group?
– What is your subsystem? Remind students that their subsystem should be pertinent to their interest group.
– What systems component are you bringing into your experiment? For systems science, we need a great deal of data and a variety of data. How are you working toward achieving both the large amount of data and variety? Also, we generally use multiple stressors in systems experiments. This means that instead of changing only one variable and keeping everything else constant, we allow for multiple variables. This mimics what occurs more naturally in nature. For instance, if you change the amount of light, temperature often changes with it. Instead of allowing one to change and unnaturally holding the other constant, we allow them to change as they may together. The way this is accomplished is through experimental design – ensure the data you gather allows you to trace back to what caused the outcome observed.
6. Have students join their pre-determined interest groups (which are according to stakeholders). Instruct them to further brainstorm within their group about a possible lab experiment. You can leave Slide 12 on the board to help remind students what needs to be completed as they prepare for their experiment. Slides 13 – 18 contain information that may or may not be needed for your students. Slide 14 gives a list of all of the interest groups. Slides 15-18 list possible experimental conditions and information. More examples of different experimental possibilities can be found in the Teacher Guide to Experiments document (Google Doc | Word Doc). Click here for a photo of a teacher’s whiteboard list demonstrating the many different experimental options.
After approximately 5-10 minutes of brainstorming, have students come up with an experimental plan and a flow chart of their experiment. Having students follow this experimental plan procedure tends to lead to successful implementation of these types of labs in the classroom:
Experimental Plan
- Refine your question – work off of the main question to narrow it and make it your own. Make it interesting and applicable to your interest group.
- Develop your hypothesis. In addition to using “if…then…because…” you should focus on your prediction and the measures that will tell you if your hypothesis is supported or not.
- Develop a procedure draft. Include a flow chart mapping out the steps you will take.
- List all materials you will need, complete with size and amount.
7. Monitor student groups by walking around. Listen to each group’s plan and provide appropriate feedback and suggestions. As they decide on experiments, have students list what they plan to test and measure on a large piece of posted butcher paper or in a collaborative document. This will allow students to build off of others’ experiments instead of replicating others’ experiments. For example, if two groups want to study how diatoms respond to various temperatures within acidified water, see if they can come up with a way to alter their experiments to build on each other (e.g. perhaps one can model their temperature from tropical zones and the other for arctic zones).
Many teachers find it helpful to track student experiments as you move about the classroom.
- Here is a Teacher Resource – Tracking of Student Group Experiments (Google Doc | Word Doc).
- Also, here is a guide, also listed above that contains possible experiments: Teacher Resource – Teacher’s Guide to Student Experiments (Google Doc | Word Doc) and again an example of a whiteboard list of experiments.
- Here is a “How Do You Measure Ocean Acidification” infographic from the OA Alliance. Also, downloadable here. This infographic may be helpful for you or your students when making decisions on the type of data that will be generated and gathered through the upcoming experiments.
8. At the end of the lesson, each group should hand in one sheet with their experimental plan and a flow chart of their experimental procedure. Use their material list to begin preparing for the upcoming lab and to provide needed assistance for a class set of cohesive experiments.
You completed Instructional Activities. Please move to Assessment via the tab above.
Assessment
How will I know they know?
- Completed Lab Planning Tasks:
- Were students able to
- participate in the discussion?
- collaborate in their groups to define their subquestion?
- develop their hypothesis and predictions?
- list what they will measure and what it would tell them?
- list what materials they will need (complete with sizes and amounts)?
- develop their procedural draft (including a flow chart)?
- (as needed) refine their experimental idea based on others’ ideas?
- hand in their final plan?
- Were students able to
- Mini-Surveys: As part of our effort to ensure quality STEM learning experiences, we invite you to participate in short, but informative surveys. You can complete one, all or any variation between. Here is a downloadable Teacher Overview to guide you through all surveys.
- A mini-survey is a short survey (1-3 minutes) that students and teachers will use several times over the course of the module. The questions are identical each time, so the same link can be used each time.
- Student Mini-survey link (https://www.surveymonkey.com/r/OA_StudentSurvey). Please provide 2-4 minutes for students to complete the mini-survey while in class. It should take most students one minute or so, especially after the first survey or two (because the questions remain the same).
- When prompting students to take this survey at this timepoint (#3), please remind students that this survey covers information taught over the last two lessons. Here is an example prompt for students: Take this mini-survey while thinking of the lessons we completed on [Friday and Monday] that allowed you to:
- plan with your interest group
- develop your experimental question, hypothesis and procedure
(Please remove and replace any necessary text above that helps your students think of what they have completed as part of this module.)
- When prompting students to take this survey at this timepoint (#3), please remind students that this survey covers information taught over the last two lessons. Here is an example prompt for students: Take this mini-survey while thinking of the lessons we completed on [Friday and Monday] that allowed you to:
- Please complete the teacher survey while students are taking the mini-survey, or at the end of the day. Please take it on the same day the students take theirs (https://www.surveymonkey.com/r/OA_TeacherSurvey).
- Here is the entire Survey Teacher Guide that you can use when implementing these surveys. Thank you!
Resources
- Teacher Resource – Teacher’s Guide to Student Experiments (Google Doc | Word Doc)
- Teacher Resource – Planning Cohesive Experiments PowerPoint Presentation (Google Slide | PowerPoint)
- Teacher Resource – Image of Brainstorming on Possible Student Experiments (JPG)
- Teacher Resource – Tracking of Student Group Experiments (Google Doc | Word Doc)
- Teacher Resource – “How Do You Measure Ocean Acidification” infographic; also, downloadable here.
- Teacher Resource – Project 2061’s Questions to Ask about Systems (PDF)
Accommodations
Depending on your students, they may need a worksheet to help them track their experimental planning and/or their discussion participation. One can be created by copying the text from the PowerPoint slides (Google Slide | PowerPoint) to create a more guided experience.
Extension
Scientists who are studying ocean acidification are generally very passionate about their research and more than willing to discuss their work with interested teachers and students. Through field testing, we learned that students love having a guest speaker Skype into the classroom. We suggest searching online to find scientists that study ocean acidification. Teachers or students can find and suggest someone to the class. Emails can be sent directly to that scientist giving a description of who you are and what you are interested in learning about. People are happy to spend 20 minutes talking to students about their work. You can contact us to talk to a scientist or reach out to the many other labs that work on ocean acidification. Here are just a few suggested groups who work on ocean acidification to get your search started: NOAA, Scripps Institution of Oceanography, University of Hawaii C-MORE, Stillman lab at Berkeley, University of Washington, Woods Hole Oceanographic Institute, Monterey Bay Aquarium Research Institute, etc.
References
Many teachers and scientists participated in the creation of these lessons and content. Please view the list of credits for this work. For this lesson, these additional references are specifically noteworthy:
1. Keeley, P., Tugel, J. (2009). Uncovering student ideas in science: 25 new formative assessment probes (Vol. 4). Arlington, VA: NSTA Press.
2. See the Waters Foundation website for many systems thinking resources: http://www.watersfoundation.org
3. Photo of Brainstorming Wall submitted by Jennifer Duncan-Taylor of Port Angeles High School in WA.